


Introduction
Gallstone disease is an important problem that causes considerable expense in healthcare systems worldwide. Gallstones are not only responsible for cholecystitis but also 30~75% of cases of pancreatitis as well as biliary obstruction and cholangitis. In the United States alone, 500,000~600,000 cholecystectomies are performed annually [1]. When gallstone disease presents as acute cholecystitis, complete recovery can be expected after successful cholecystectomy. However, not all patients are suitable for surgical intervention due to individual preoperative risk factors and many serious gallstone diseases such as cholangitis and pancreatitis, can be treated by non-surgical removal of gallstones.
Gallstones are classified as cholesterol or pigment. About two-thirds of gallstones are cholesterol gallstones, the remaining are pigment stones that contain less than 30% cholesterol. Cholesterol gallstones can contain as much as 30% calcium bilirubinate and are sometimes called ‘mixed’ stones. Pigment gallstones are classified descriptively as ‘black’ or ‘brown’. They are composed mostly of calcium hydrogen bilirubinate, which is polymerized and oxidized in ‘black’ stones but remains unpolymerized in ‘brown’ stones. So it is important to identify the composition of gallstones, because cholesterol gallstones may be treatable by non-surgical means [2-9], including oral bile salts therapy, extracorporeal shock wave lithotripsy (ESWL) [10, 11] and contact dissolution therapy with methyl tertbutyl ether (MTBE) [12].
For these reasons, an accurate and reliable means of detection and characterization of gallstones that may be eligible for non-surgical treatment modalities has been a topic of great interest. Moreover, it is not always possible to detect gallstones on conventional computed tomography (CT). Recently, dual-energy computed tomography (DECT) has become available for clinical use. Certain materials will show characteristic changes in attenuation value (Hounsfield Units; HU) on DECT based on the X-ray spectrum to which they are exposed (the dual-energy effect) [13]. Based on this physical background, it is theoretically possible to distinguish the composition of tissues on DECT. DECT can obtain higher and lower kilovoltage peak (kVp) datasets using two tubes simultaneously during a single scan, with acceptable image noise [14-16]. In practice, 80 kVp, 100 kVp and 140 kVp datasets on DECT were commonly used in South Korea according to the various clinical conditions considering image quality, radiation dose and iodine contrast agent dosage.
Many recent studies have shown the clinical applications of DECT including differentiation of urinary stones (uric acid versus calcium stones) [17-20] and have examined the sensitivity of DECT at different kVp images for detection and compositional analysis of gallstones (high percentage of cholesterol components versus calcium components) [21]. Thus, using DECT, it should be possible to distinguish cholesterol and pigment gallstones by analyzing specific absorption characteristics of the constituent materials at different tube voltages [15, 22, 23]. There was no published report about differentiation of gallstones from living patients in clinical setting of cholecystitis using DECT. The purpose of this study was to investigate whether ex-vivo gallstones from living patients in a clinical setting could be distinguished by type using DECT with both qualitative and quantitative analyses of gallstone attenuation.
Materials and Methods
Patients
This study was approved by the ethics committee of our hospital. Patients who underwent cholecystectomy because of clinically suspected acute or chronic calculous cholecystitis from September 2013 to April 2015 (about 20 months) were retrospectively reviewed on electronic medical record and were enrolled in this study. Patients who met the following criteria were selected: (1) cholecystectomy performed at the department of hepatobiliary surgery of our hospital; (2) preoperative dual energy computed tomography (DECT) performed during detailed clinical evaluation for patients suspected of acute cholecystitis with symptom of biliary colic or chronic cholecystitis before possible surgery, regardless of using preoperative US; (3) gallstones measuring 5 mm or longer on gross examination after surgical extraction; (4) no pathologically proven coexistent biliary diseases, such as gallbladder polyp or malignancy. Preoperative clinical DECT using 140 kVp and 100 kVp tube voltage was performed for detailed evaluation of clinical settings by surgeon’s decision, not an extra preoperative step for participation in this experiment, to rule out other surgical or nonsurgical conditions in addition to gallstone diseases. In this experiment, the role of clinical DECT was limited to measure gallstone size and prepare the future study to correlate the clinical DECT results with FTIR results.
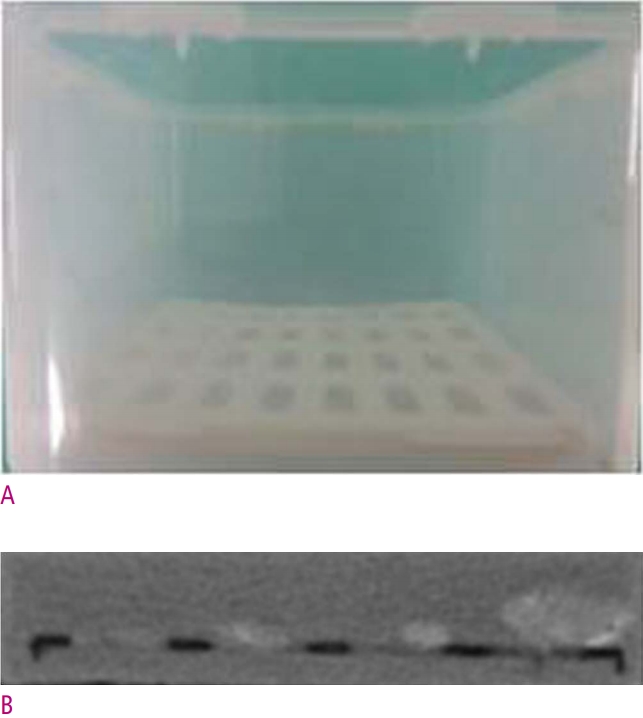
In total, one hundred sixty two patients who underwent cholecystectomy were included. First, fifty two patients who did not undergo DECT on clinical settings were excluded. Next, ten patients who did not have measurable gallstones on gross examination and twenty patients who had gallstones measuring 5 mm or smaller were excluded. Immediately after collection, the gallstones were placed in an acrylic container 30 cm wide × 20 cm long and 20 cm high (produced at our department; Fig. 1A) in order of size for DECT scan. Fifteen patients, whose gallstones were shattered or unsinkable in the acrylic container filled with distilled water, were also excluded. Finally, 124 gallstones from 65 patients were eligible for inclusion in this study.
Gallstone size
The mean diameter of all visible gallstones was 10 mm (range, 5 to 44 mm). The mean diameter of the 66 cholesterol gallstones was 11.4 mm (range, 5 to 44 mm) and the mean diameter of the 58 pigment gallstones was 8.7 mm (range, 5 to 16 mm); the size difference between the cholesterol and pigment gallstones was statistically significant (P < 0.018).
Scan protocol of DECT
The gallstones were placed in an acrylic container 30 cm wide × 20 cm long and 20 cm high (produced at our department; Fig. 1A). A maximum of 3 largest pieces of uncrushed sinkable gallstones were selected randomly and placed at the center of the container in order of size (Fig. 1B). The composition of 3 pieces of stones were not known in advance. This process was performed by the internship doctor without having any idea what its purpose was. The container was then filled with distilled water at room temperature and scanned with DECT. We used a SOMATOM Definition Flash dual-source MDCT scanner (Siemens Healthcare, Forchheim, Germany) in this study. Two CT scans of the collected gallstones were performed with the dual-source CT system using a dualenergy protocol. For scan 1, tube voltage/current were 140 kVp/135 mA on tube A and 80 kVp/350 mA on tube B, with the following parameters: configuration, 64 × 0.6 mm; rotation time, 0.33 second; and pitch, 0.6. For scan 2, tube voltage/current were 140 kVp/135 mA on tube A and 100 kVp/300 mA on tube B, with the same parameters. The reason why 100kVp scan was used was to evaluate that 100 kVp scan could be helpful to detect gallstones and differentiate the gallstone composition compared to 80 kVp scan. Three image sets (80, 100, and 140 kVp, respectively) were obtained and images were reconstructed at a slice thickness of 5 mm in a standard abdomen window setting (width 300 HU, center 40 HU).
Image interpretation of DECT
Two abdominal radiologists with experience of 3, 20 years respectively read all DECT images in consensus. All image sets were displayed, respectively, side-by-side in regular sequence in CT scans. The readers knew that all image sets included stones and were not blinded as to which images represented the 80, 100, and 140 kVp image sets. The reader was blinded to which postop stones corresponded to which preop scans. Both readers interpreted the images of the gallstones removed by cholecystectomy together. Preoperative clinical DECT scan was interpreted by 3-year-experienced reader. Window settings could be freely adjusted at all kVp image sets.
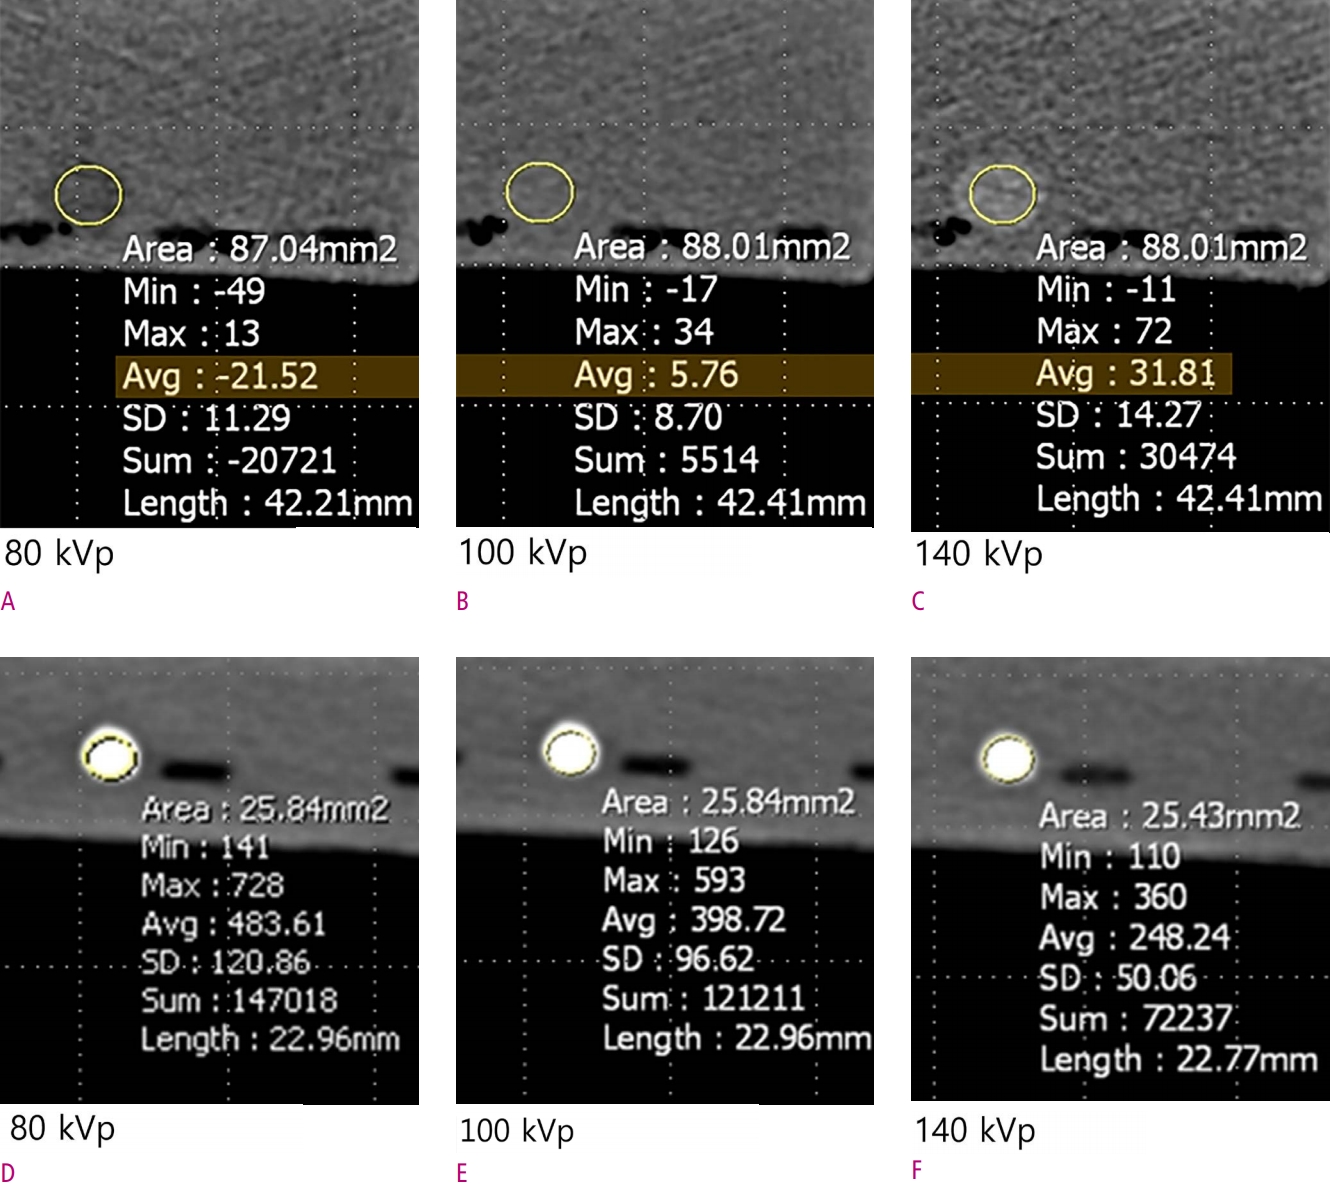
Qualitative and quantitative analyses were performed for each image set (Fig. 3). For qualitative analysis, gallstone detection was rated according to a 4-point scale, where 1 indicated definite absence of stone, 2 indicated probable absence of stone, 3 indicated probable presence of stone, and 4 indicated definite presence of stone. For the qualitative assessment of gallstone attenuation, the gallstones were classified during the visual exam as hypodense, isodense, hyperdense, or mixed, according to their CT attenuation patterns compared to the surrounding distilled water.
On quantitative analysis, attenuation values of gallstones were measured using a circular region of interest (ROI) tool at each kVp image set. ROI cursors were situated at the same Z-axis position on all image sets to avoid misregistration. For gallstones displaying homogenous attenuation patterns, the largest possible ROI was measured. For the gallstones that displayed heterogeneous attenuation patterns (e.g., core-and-shell and target appearance), ROI measurements were performed in the major sectors of the gallstones by correlation with FTIR spectroscopy results. Each ROI measurement was performed 3 times to minimize the effect of measurement errors, and the mean attenuation values of the gallstones were calculated. The corresponding attenuation values of gallstones were plotted in a diagram for each group. Additionally, the maximum diameter of each gallstone was measured and the mean sizes of the gallstones were calculated.
Fourier transform infrared spectroscopy
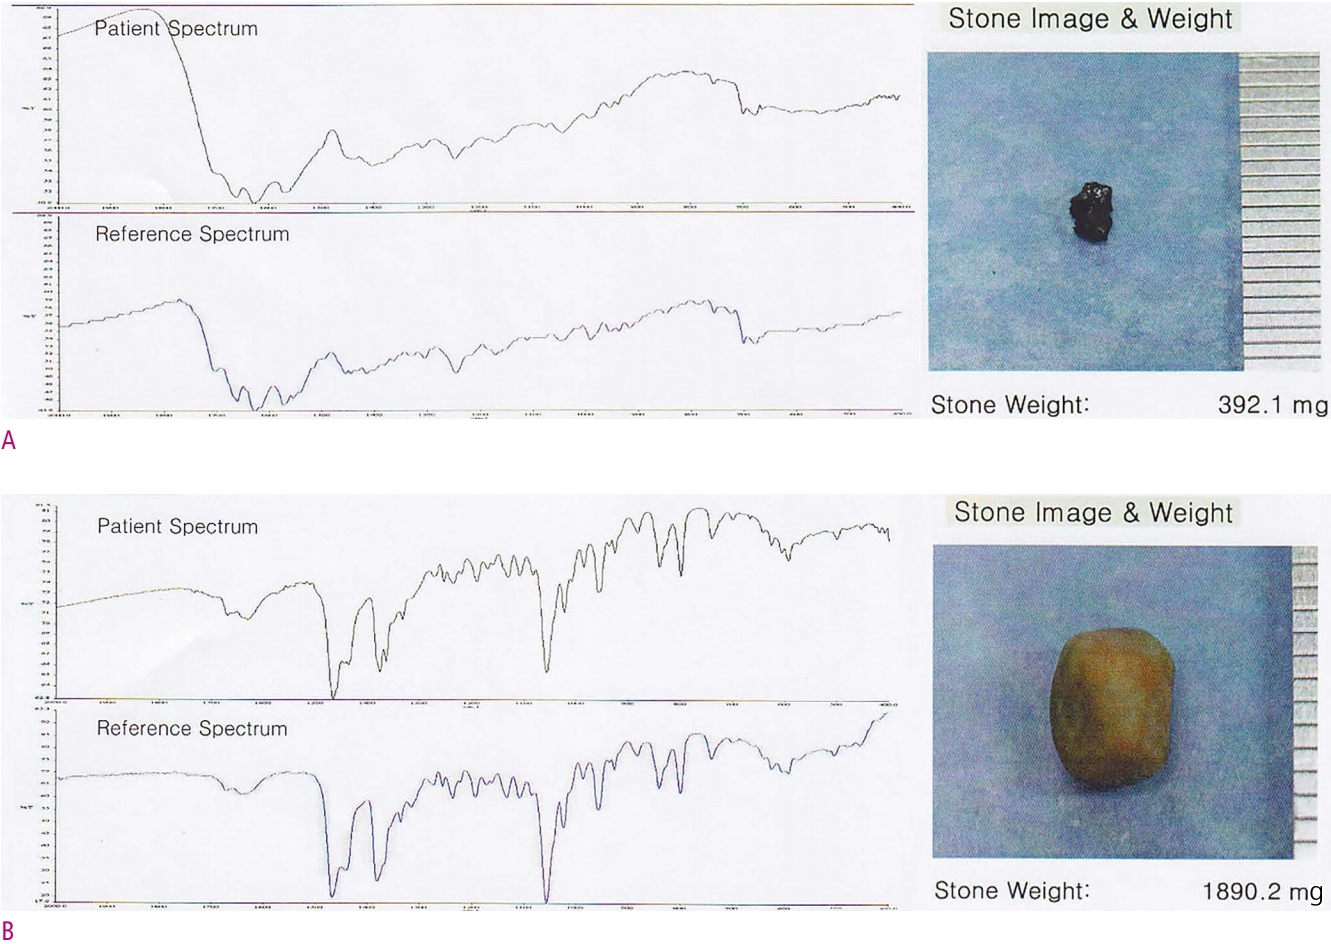
After DECT scanning and interpretating the images, the gallstones were subsequently analyzed with Fourier transform infrared (FTIR; IFS 28, Bruker, Karlsruhe, Germany) spectroscopy (Fig. 2). FTIR spectroscopy was performed by the pathologic investigators with over 5 year experience. On FTIR spectroscopy, the sample to be analyzed was mounted in a solvent (potassium bromide; KBr) and passed through a known infrared (IR) spectrum, where emission and absorption of specified wavelengths were measured in order to determine the chemical compositions of the samples based on the emission/absorption characteristics [24].
Preparation of the gallstone samples was performed without the reference to the DECT images. The gallstones were ground in toto, mounted in the KBr solvent, and analyzed regardless of the CT attenuation patterns. The FTIR spectroscopy measurements were determined with the support of computer-based libraries for reference spectra. The results were described semi-quantitatively.
Statistical analysis
Statistical analyses were performed using dedicated software (SPSS 21.0 for Windows statistical software). For qualitative analysis, sensitivity values for gallstone detection were calculated at all kVp image sets for each group of gallstones (cholesterol gallstones and pigment gallstones), respectively. Visual assessment of the gallstone attenuation was displayed at each group and compared at corresponding kVp image sets (80-100, 80-140, 100-140 kVp image sets) using the x2 test. For quantitative analysis, the mean attenuation values of gallstones were calculated in each group and compared at corresponding kVp image sets using the paired t test.
Results
Qualitative analysis of gallstones by DECT and correlation with spectroscopy results
Gallstone detection
Gallstones with peak concordance of >80% possibility of cholesterol on FTIR spectroscopy were identified as cholesterol gallstones and those identified as 100% calcium bilirubinate were defined as pigment gallstones (Fig. 2). With these FTIR spectroscopy results as the reference standard, 64 of 66 (97%) cholesterol gallstones were detected by 80 kVp DECT, and this setting demonstrated the highest sensitivity for detection of cholesterol gallstones (Table 1). 100 kVp scan (86%) represented the lower sensitivity to 80 kVp scan. Fifty seven of 58 (98%) pigment gallstones were detected by DECT at all three settings, and the sensitivity for detection of pigment gallstones was equal at all three settings (Table 1). On preoperative clinical DECT exams, 46 of 66 cholesterol (70%) gallstones were detected, and 57 of 58 (98%) pigment gallstones were detected.
Visual assessment of gallstone attenuation
At 80 kVp, 52 of 66 (79%) cholesterol gallstones showed low attenuation and 14 of 66 (21%) cholesterol gallstones showed iso- or high attenuation (P = 0.041), while at 140 kVp, 43 of 66 (65%) cholesterol gallstones had high attenuation and 23 of 66 (35%) demonstrated iso- or low attenuation (P < 0.001) (Table 2, Fig. 3). Moreover, of the 52 cholesterol gallstones that demonstrated low attenuation at 80 kVp, 46 (88%) had iso- or high attenuation at 140 kVp. In contrast, all the pigment gallstones detected by DECT demonstrated high attenuation across all kVp settings (Table 2, Fig. 3). At 100 kVp scan, the percentage of cholesterol stones showing isodense attenuation was increased, and the percentage of cholesterol stones showing hypodense attenuation was decreased, compared to 80 kVp scan. But, pigment stones did not show visual attenuation difference between the two kVp scans.
Quantitative analysis of gallstones by DECT and correlation with spectroscopy results
Calculated attenuation values
Because the sensitivity for gallstone detection was highest at 80 kVp, ROI measurements were made using the 80-kVp image set. The results of the ROI measurements are shown in Figure 3.
The mean calculated attenuation values (mean ± standard deviation, SD) of the cholesterol gallstones were -17 ± 50 HU, -5.1 ± 43 HU, and 19.2 ± 39 HU at 80, 100, and 140 kVp, respectively (Table 3). These results were statistically significant for all comparative kVp analyses (P < 0.001) and they indicate that the attenuation values of cholesterol gallstones tend to be higher at 140 kVp than at 80 kVp.
The mean calculated attenuation values of the pigment stones were 342 ± 173 HU, 286 ± 116 HU, and 195 ± 91 HU at 80, 100, and 140 kVp, respectively (Table 3). These results were statistically significant at all comparative kVp analyses (P = 0.001) and they indicate that the attenuation values of pigment gallstones tend to be higher at 80 kVp than at 140 kVp.
Discussion
CT is an important imaging technique in the detailed evaluation of gallstone diseases. Acute or chronic cholecystitis can be generally treated by cholecystectomy. However, not all patients with gallstones can tolerate cholecystectomy, and not all gallstone diseases can be treated by cholecystectomy. There are nonsurgical options for treatment of gallstones, among them oral bile salts, extracorporeal shockwave lithotripsy, and contact dissolution therapy with methyl tert-butyl ether (MTBE). The principal non-surgical medical treatment for cholesterol gallstones is oral litholysis with bile salts [13]. Ursodeoxycholic acid (UDCA) is the most widely used agent of medical treatments for gallstone disease by oral litholysis but practically devoid of side-effects [14]. Because the success of these therapies depends on the composition of the gallstones, it is important to distinguish cholesterol gallstones from pigment gallstones [2-9]. This may be possible with DECT.
Many recent studies have shown the clinical applications of DECT including differentiation of urinary stones (uric acid versus calcium stones) [17-20] and have examined the sensitivity of DECT at different kVp images for detection and compositional analysis of gallstones (high percentage of cholesterol components versus calcium components) [21]. DECT has made it possible to distinguish cholesterol gallstones from pigment gallstones by analyzing specific absorption properties of the materials at different tube voltages using postprocessing algorithms [15, 22, 23].
In this study, ex-vivo gallstones were distinguishable as cholesterol gallstones or pigment gallstones on DECT. The gallstones showed characteristic attenuation patterns, with cholesterol gallstones having significantly lower attenuation patterns on low kVp (80 kVp) versus high kVp (140 kVp) image sets (P = 0.041), as confirmed by calculated mean attenuation values (P < 0.001), and the pigment gallstones showing higher attenuation values at low kVp versus high kVp image sets (P < 0.001). Cholesterol is a lipid consisting of four linked hydrocarbon rings forming a bulky steroid structure. At higher energies, fat has a somewhat higher Compton mass attenuation coefficient than other body tissues [24]. Because hydrogen contributes a larger proportion of the mass in fat than it does in soft tissue and bone, fats have a larger electron density than other tissues. This becomes particularly important at higher energies, where Compton interactions dominate attenuation as it contributes to the high attenuation of fats at higher energies of CT.
Chan et al. [25] reported that the mean CT attenuation of cholesterol gallstones was significantly lower than that of pigment gallstones at four voltage settings (80, 100, 120, and 140 kVp) of single-energy CT. This was similar to the result in the present study. However, they suggested that single-energy CT attenuation measurements were not useful for determination of gallstone composition because there was extensive overlap in the CT attenuation values between the two types of gallstones. In our study, cholesterol gallstones were distinguished from pigment gallstones by visual assessment and ROI measurement of attenuation in three kVp image sets at DECT, indicating that dual-energy CT attenuation measurements are useful for determination of gallstone composition.
There was a report about in-vitro results for differentiation of gallstone components using DECT [26]. That report stated that DECT had poor sensitivity but good specificity for the identification of cholesterol gallstones, and the authors found that DECT was able to correctly classify gallstones according to a reference standard based on visual assessment of the gallstones by a single pathologist. The findings were similar in the present study, and they were based on an FTIR chemical analysis as the reference standard. Moreover, in the present study, we have quantified mean attenuation values and ranges for two types of gallstones.
Another recent study sought to distinguish cholesterol gallstones from pigment or mixed gallstones with DECT by defining reliable attenuation values for autopsy specimens [21] using FTIR as a reference standard. The authors reported that cholesterol gallstones without calcium components showed typically low attenuation at 80 kVp and high attenuation at 140 kVp. There was not an extensive overlap in the attenuation values between the two types of gallstones. Their results were very similar to those reported here, although in the present study, the gallstones were obtained from living patients at cholecystectomy and were placed in the distilled water for DECT analysis, as opposed to formalin, which may have influenced the CT attenuation characteristics of the gallstones [27].
To our knowledge, the present study is the first to perform both qualitative and semiquantitative analyses of gallstone attenuation in DECT, not single energy CT, by using gallstones from living patients, not autopsy specimens, in a clinical setting of cholecystitis and with FTIR results as an objective reference standard. There are no reports performed in living patients with gallstones by DECT. Furthermore, distilled water used as a covering solution would not be expected to influence the attenuation value of the gallstones.
Infrared (IR) or Fourier transform infrared (FTIR) spectroscopy has a large range of applications, from the analysis of small molecules or molecular complexes to the analysis of cells or tissues [24]. In this study, FTIR spectroscopy measurements were verified with the help of computer-based libraries for reference spectra. Results were displayed semi-quantitatively so that gallstone components could be described by percent.
This study has several limitations. First, we did not completely correlate gallstone compositions at DECT with the FTIR results because the results of FTIR were reported semi-quantitatively. FTIR results didn’t mean the percentage of stone compositions, but they mean how the stone spectra are matched with computer-based libraries for reference spectra. FTIR results of 58 pigment gallstones were identified with 100% possibility (peak concordance) of calcium bilirubinate and phosphates, it meaned they were completely concorded with the reference spectra. But the results of 66 cholesterol gallstones were identified with >80% possibility (peak concordance) of cholesterol, it meaned they were not completely concorded with the reference spectra. In practice, the 124 stones contained many kinds of components in addition to cholesterol and calcium. They were identified as cholesterol, bilirubin, carbonates, phosphates, and/or protein. The bilirubin turned out to be modified calcium bilirubinate. Phosphates were also accompanied with calcium as a counter ion.
Second, this study was non-blinded. The two readers already knew the gallstone composition by correlation with FTIR spectroscopy before they read the DECT images. Therefore, the measured portions of the gallstones were selected as the sectors that correlated with the composition reported at FTIR spectroscopy. They knew that all image sets included stones, the inclusion of “1-definite absence of stone” in the qualitative rating scale is counterintuitive and there is a bias toward higher grading for detectability. And 124 ex-vivo gallstones represented a relatively small sample size. Lastly, this study did not compare in vivo and in vitro imaging, and thus limits applicability of this work to clinical radiology.
In conclusion, ex vivo gallstones were distinguishable as cholesterol gallstones or pigment gallstones at DECT. Unlike cholesterol stones which increase with increasing kVp, pigment stones decrease in attenuation value within increasing kVp. This, along with overall higher attenuation values in general, will likely allow in vivo composition discrimination. In clinical settings, DECT would be expected to verify the results of this study and their reproducibility for routine use.
 PDF Links
 PubReader
 ePub Link
 Full text via DOI
 Download Citation
 Print
Print