


Introduction
Hepatocellular carcinoma (HCC) is a major cause of cancer-related mortality worldwide [1, 2]. HCC develops via multistep carcinogenesis in a background of chronic liver disease, where an early HCC (eHCC) develops from a premalignant dysplastic lesion, then eventually to a progressed (moderately or poorly differentiated) HCC [3, 4]. Early HCCs are histologically defined as vaguely nodular, well-differentiated HCCs with stromal invasion [5, 6], and are characterized by a lower risk of recurrence and higher 5-year survival rate than progressed HCCs after treatment [7, 8]. Therefore, the detection of eHCCs may help decrease mortality associated with HCC, and increase opportunities for curative treatment [9, 10].
The detection and characterization of eHCCs is more difficult than progressed HCCs, given that the former are usually small (< 2 cm) and demonstrate fewer discernible findings via computed tomography (CT) and extracellular contrast-enhanced magnetic resonance imaging (MRI) [11-14]. Diagnostic imaging via gadoxetate disodiumenhanced MRI (EOB-MRI) is superior to multiphase dynamic CT, as eHCCs are depicted as hypointense nodules in hepatobiliary phase (HBP) images [15-19]. However, the reported features of eHCCs on EOB-MRI are highly variable. Importantly, the incidence of arterial phase hyperenhancement (APHE), a hallmark for HCC diagnosis, ranges widely, from 13% [15] to 37% [16]. Moreover, although diffusion-weighted imaging (DWI) has been recognized as an important tool in HCC diagnosis, especially in non-hypervascular HCCs [20-22], the appearance of eHCC by DWI is limited to only a few reports with relatively small subject numbers [11, 17].
Therefore, the aim of this study was to describe the imaging features of histologically defined eHCCs based on EOB-MRI and DWI in a relatively large number of subjects.
Materials and Methods
Patients
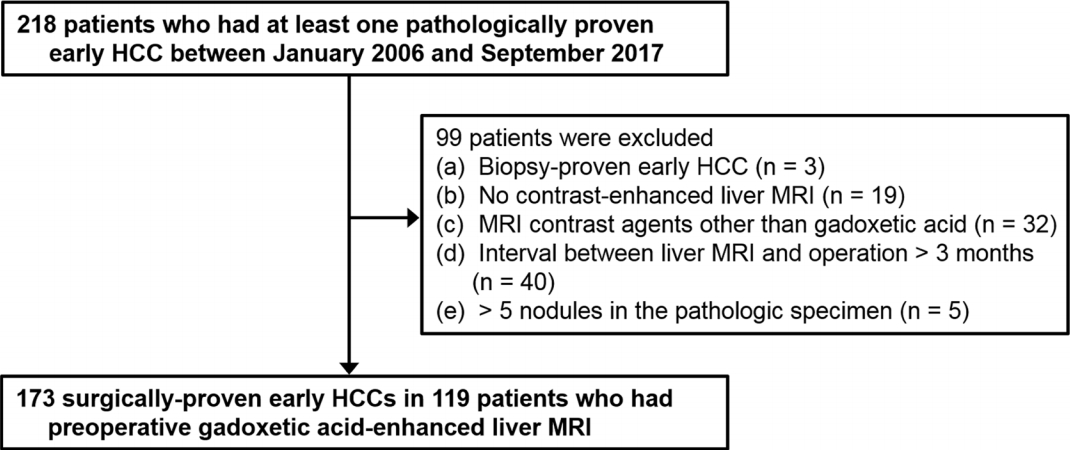
This retrospective study was approved by our Institutional Review Board, and the requirement for informed consent was waived. From January 2006 to September 2017, 218 adult patients who presented with at least one pathologically confirmed eHCC were identified from institutional electronic medical records. The study inclusion criteria were as follows: (a) patients who underwent surgery for eHCC; (b) those with preoperative EOB-MRI. Ninety-nine patients were excluded from the study for the following reasons: (a) biopsy-confirmed eHCC without surgery (n = 3; to exclude the possibility of biopsy tissue sampling an eHCC portion of a progressed HCC); (b) no contrast-enhanced liver MRI (n = 19); (c) MRI using contrast agents other than gadoxetate disodium (n = 32); (d) interval between liver MRI and surgery > 3 months (n = 40); (e) > 5 nodules in the pathological specimen (n = 5; due to difficulty in correlating the radiological and pathological findings). Thus, 119 patients were included in our study (Fig. 1). The median interval between MRI and surgery was 26 days (range, 0-86 days).
Electronic medical records were retrospectively reviewed for clinical findings and laboratory data. Clinical findings included patient characteristics, chronic liver disease etiology, history of HCC treatment, and type of liver surgery. Laboratory data included serum albumin, total bilirubin, aspartate transaminase, alanine transaminase, and alpha fetoprotein. The Child-Pugh score and albuminbilirubin (ALBI) grade were both calculated to evaluate the hepatic function of the study population [23-25].
Pathological diagnosis
Pathological examination was performed by a senior liver pathologist (with more than 20 years of experience in hepatic pathology), together with one or two residents or a fellow. The pathological reports included the fibrosis grade of the non-tumor-bearing liver parenchyma and the location, size, and number of eHCCs and progressed HCCs. Diagnosis of eHCC was based on the established histological criteria of a small, well-differentiated HCC of a vaguely nodular type, with combinations of the following histological features: (a) increased cell density more than two times that of the surrounding parenchyma, with an increased nuclear/cytoplasm ratio and irregular thin-trabecular pattern; (b) varying numbers of intratumoral portal tracts; (c) pseudoglandular pattern; (d) fatty change; (e) varying numbers of unpaired arteries (6). Importantly, the presence of stromal invasion was useful for differentiating high-grade dysplastic nodules from eHCCs [6, 26]. When morphologic criteria, such as stromal invasion, were difficult to assess, a panel of immunohistochemical markers were used to establish the diagnosis, including glypican-3, heat shock protein 70, and glutamine synthetase; eHCC was diagnosed when two or more immune-markers were positive [26].
Magnetic resonance imaging
Liver MRI was performed using a 3.0-T (MAGNETOM Tim Trio, Siemens Healthineers; Intera Achieva or Ingenia, Philips Healthcare) or a 1.5-T system (Intera Achieva or Ingenia, Philips Healthcare). Routine liver MRI sequences included dual-echo spoiled gradient-echo T1-weighted inphase and opposed-phase images, multi-shot and single-shot turbo spin-echo T2-weighted images (T2WI), single-shot echo planar DWI with b values of 50, 400, and 800 sec/mm2, and dynamic T1-weighted images (T1WI). Dynamic fat-suppressed spoiled gradient-echo T1WI was acquired before and after gadoxetate disodium injection (Primovist, Bayer Pharma AG) at a dose of 0.1 mL/kg (0.025 mmol/kg), followed by a 20-mL saline flush at an injection rate of 1 mL/sec. To determine the timing of the arterial phase, a bolus-tracking method was used. Subsequent dynamic phases were acquired at approximately 30 sec intervals; each dynamic phase required 16-22 sec. The HBP images were obtained 20 min after contrast injection.
Image analysis
The detection sensitivity of eHCC was calculated from both prospective and retrospective reading sessions. A study coordinator (an abdominal radiologist with 5 years of experience in liver imaging) performed radiologic-pathologic correlations (through review of the MRI and pathological reports) by matching the size and location of the hepatic lesions. Prospective detection sensitivity was determined from the preoperative reports of MRI examinations conducted by one of five faculty radiologists (all with more than 5 years of experience in abdominal MRI), together with one or two residents and/or fellows. A lesion was defined as “detected” when an eHCC, documented on the pathologic report, was identified and mentioned in the preoperative MRI. The original radiologic impressions of histologically confirmed eHCCs were divided into one of the following six categories: definite benign, probably benign, indeterminate, probably HCC, definitely HCC, or other malignancy such as metastasis. Thereafter, retrospective analyses were performed by the study coordinator to identify missed or unreported eHCCs; any lesions identified were included in the calculation of overall detection sensitivity and review of MRI findings.
To investigate whether the detection sensitivity was affected by image quality or hepatic function, two abdominal radiologists, with 25 and 5 years of experience in liver MRI, reviewed the MRI using a picture archiving and communication system (Centricity version 4, GE healthcare). The image quality of the HBP of EOB-MRI was evaluated using the functional liver imaging score (FLIS), previously validated in liver transplant recipients [27]. The FLIS was calculated as the sum of the following three parameters: liver parenchymal enhancement relative to the kidney (EnQS: 0, hypointense; 1, isointense; 2, hyperintense); biliary contrast excretion (ExQS: 0, no excretion; 1, excretion into peripheral intrahepatic bile ducts; 2, excretion into the common hepatic duct, common bile duct, or duodenum); and signal intensity (SI) of the portal vein relative to the liver (PVsQS: 0, hyperintense; 1, isointense; 2, hypointense). A higher FLIS indicates better image quality of the HBP. The image qualities of other sequences, including dynamic T1WI, T2WI, and DWI, were graded using a four-point scale: 1, poor; 2, fair; 3, good; and 4, excellent.
Subsequently, the same two radiologists independently evaluated the MRI features of the detected eHCCs. The reviewers were informed of the size and location of the detected eHCCs via series/image numbers and arrows on the picture archiving and communication system. Each MRI finding was evaluated for: the presence of fatty change, APHE, washout, capsule appearance, and SI on pre-contrast T1WI, T2WI, DWI, and HBP. The definition of each finding was based on the 2017 Liver Imaging Reporting and Data System [28]. For example, washout was determined from the portal venous phase only. The presence of fatty change was determined by comparison of in- and opposed- phase T1-weighted gradient-echo images. The presence of a smooth hypointense rim on HBP (HBP capsule appearance) was noted in addition to the conventional capsular appearance [29]. Capsular appearance was considered positive when it appeared around at least two-thirds of the tumor border [29, 30]. Discrepancies between reviewers were resolved by consensus review, and the consensus data were used for analysis. Original data from the independent review were used to calculate interobserver agreement.
Statistical analysis
Both per-patient and per-lesion detection sensitivities were calculated. If all eHCCs were detected in a patient, we considered this “detected” on a per-patient basis. If any eHCC was missed in a patient, we classified this as “undetected” in terms of per-patient sensitivity. Both preoperatively reported lesions and retrospectively identified lesions were regarded as detected lesions for image review, as well as for the calculation of detection sensitivity. The per-lesion detection sensitivity was also calculated according to the size of the eHCC. For per-lesion analysis, generalized estimating equations were used to adjust for possible clustering effects caused by multiple lesions in a patient. Detection sensitivities were compared among different sized groups of eHCC using logistic regression with generalized estimating equations. Baseline patient demographics and MRI quality were compared between patients with and without falsenegative lesions using independent t-tests for continuous variables and Pearson’s chi-squared test or Fisher’s exact test for categorical variables. Per-patient analyses of factors affecting the detection of eHCCs were performed using logistic regression. Multivariate analysis was performed for significant factors identified by univariate analysis. The interobserver agreement regarding MRI quality and imaging findings of detected eHCCs were assessed using weighted κ statistics as follows: κ values < 0.20, poor; 0.21-0.40, fair; 0.41-0.60, moderate; 0.61-0.80, good; 0.81-1.00, excellent [31]. Statistical analyses were performed using SPSS v23.0 software (IBM Corp.). P values < 0.05 were considered statistically significant.
Results
Detection rate of early hepatocellular carcinoma
The prospective per-patient and per-lesion detection sensitivities of eHCCs from preoperative MRI reports were 66% (78/119) and 68% (118/173), respectively. The radiologic impressions of 118 originally detected lesions were as follows: HCC, 52% (n = 61); probably HCC, 21% (n = 25); indeterminate, 25% (n = 29); probably benign, 1% (n = 1); metastasis in patients with history of other malignancy, 2% (n = 2). After retrospective review, 17 eHCCs were additionally identified in 13 patients. Thus, retrospective per-patient and per-lesion detection sensitivities were 77% (91/119) and 78% (135/173), respectively. Per-lesion sensitivity increased with eHCC size: < 1-cm lesions, 63% (35/56); 1- to 2-cm lesions, 82% (72/88); ≥ 2-cm lesions, 97% (28/29). Per-lesion detection sensitivity differed significantly between < 1-cm and ≥ 1-cm lesions (56% and 85%, respectively; P = 0.001). Detected eHCCs (mean ± standard deviation, 1.5 ± 0.6 cm) were significantly larger than undetected eHCCs (1.0 ± 0.5 cm; P < 0.001).
Patients and magnetic resonance imaging quality
The comparisons of the patient demographics and MRI quality between patients with and without false-negative findings are summarized in Table 1. Patients with a false-negative eHCC detection had a more frequent history of HCC treatment (P = 0.014) and underwent liver transplantation more frequently than resection (P = 0.008), compared to those without. In addition, the multiplicity of both total (P = 0.003) and early (P = 0.014) HCCs was greater in patients with a false-negative detection. Most patients with eHCCs had progressed HCCs (82/119, 69%) in addition to eHCC, but the presence of progressed HCCs did not differ significantly between patients with and without a false negative detection of eHCC (P = 0.742). Liver function, determined by the Child-Pugh score, ALBI grade, and laboratory findings, did not differ significantly between the groups (Ps ≥ 0.138). Hepatobiliary phase image qualities, determined by EnQS and FLIS, were significantly higher in patients without false-negative detection (P = 0.038 and P = 0.004, respectively). Similarly, the image quality of T2WI were significantly higher in patients without false-negative detection (P = 0.032), but those of dynamic phase and DWI did not differ significantly between the groups (P = 0.464 and P = 0.130, respectively).
Interobserver agreement of MRI quality was good to excellent (EnQS, κ = 0.757 [95% confidence interval (95% CI), 0.644-0.870]; ExQS, κ = 0.824 [0.699-0.950]; PVsQS, κ = 0.834 [0.705-0.962]; dynamic phase, κ = 0.849 [0.770-0.928]; T2WI, κ = 0.675 [0.556-0.795]; and DWI, κ = 0.730 [0.632-0.829]).
Magnetic resonance imaging findings
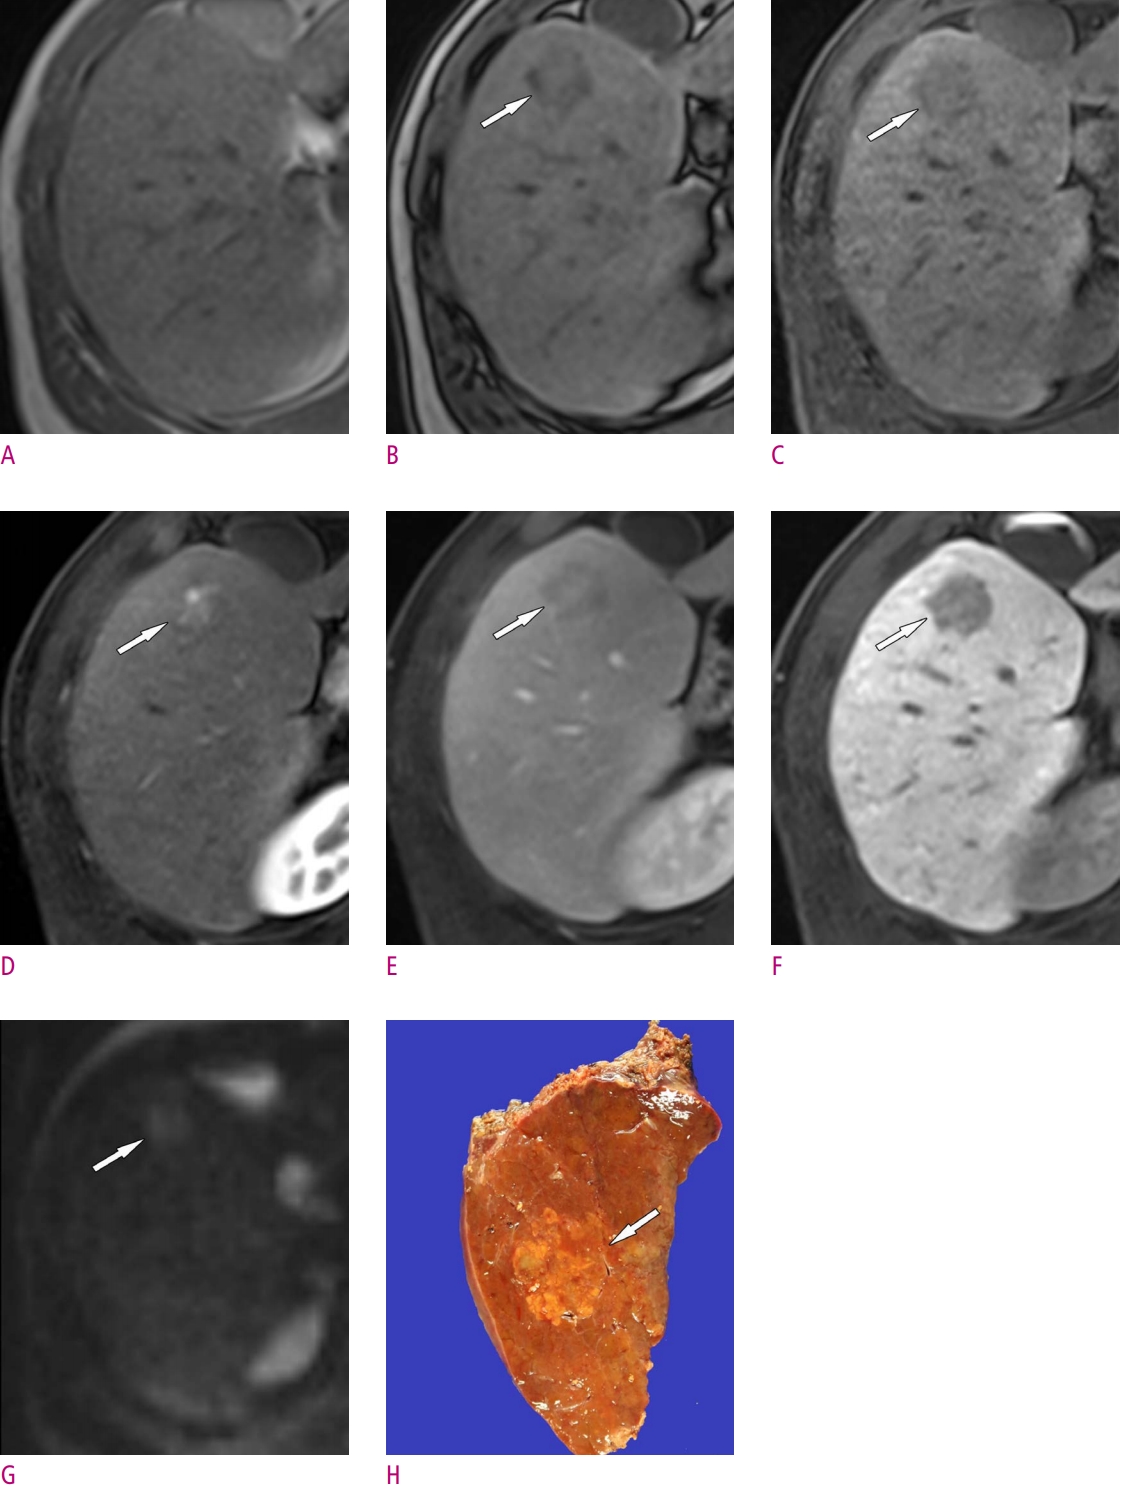
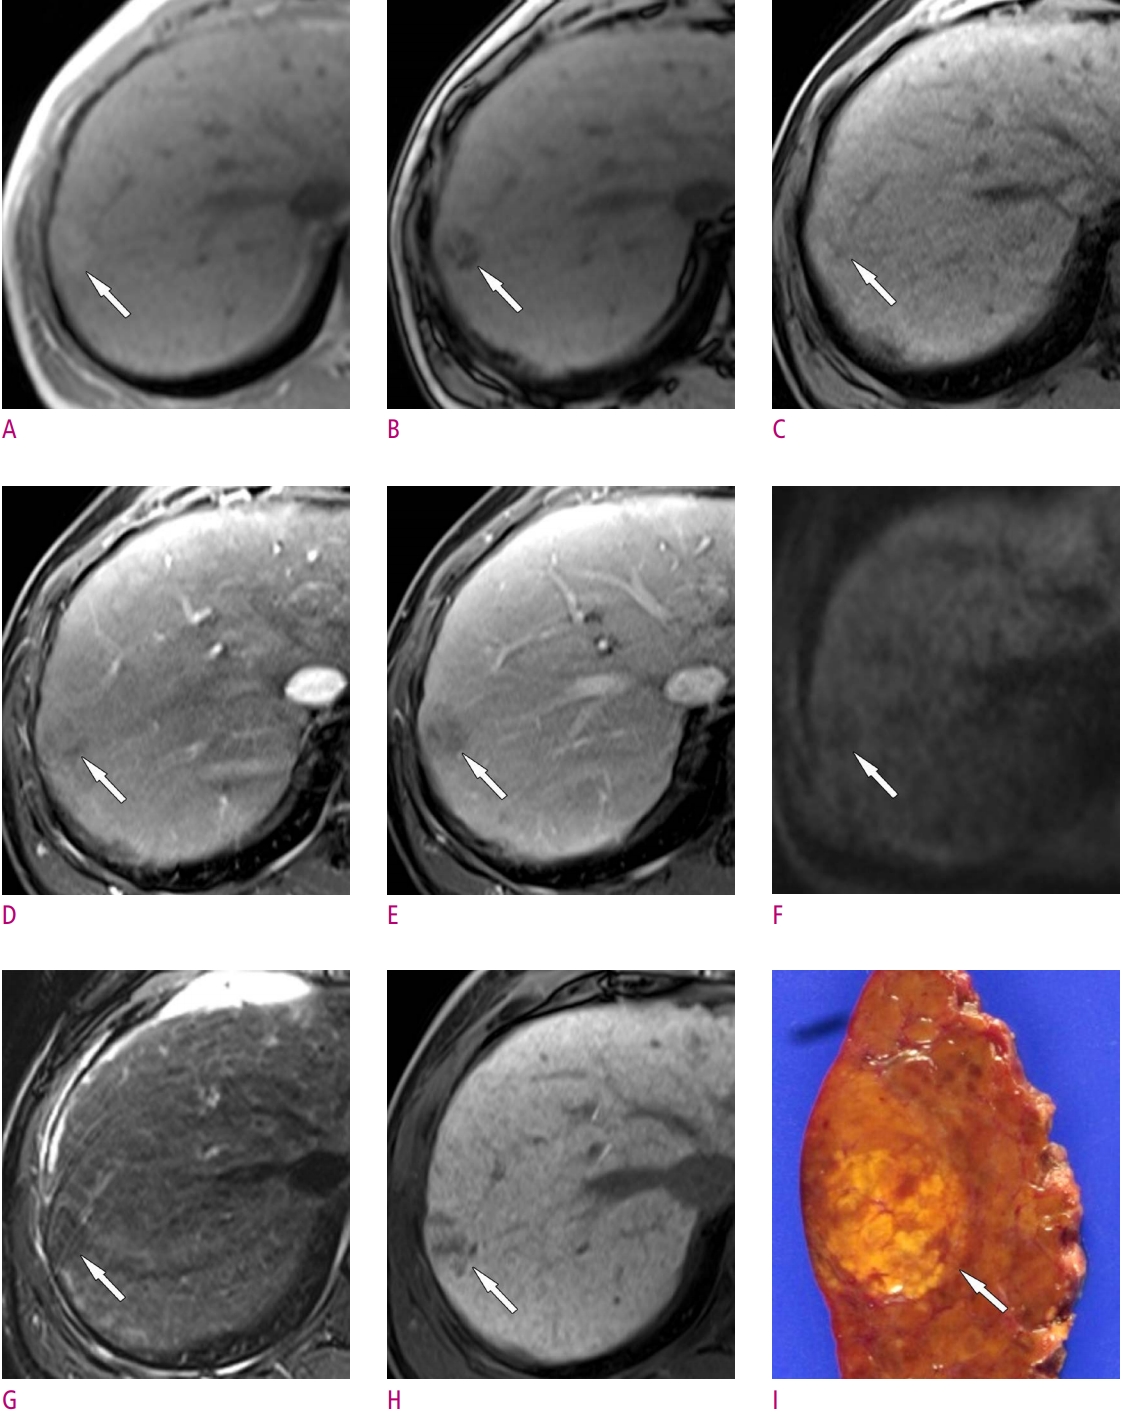
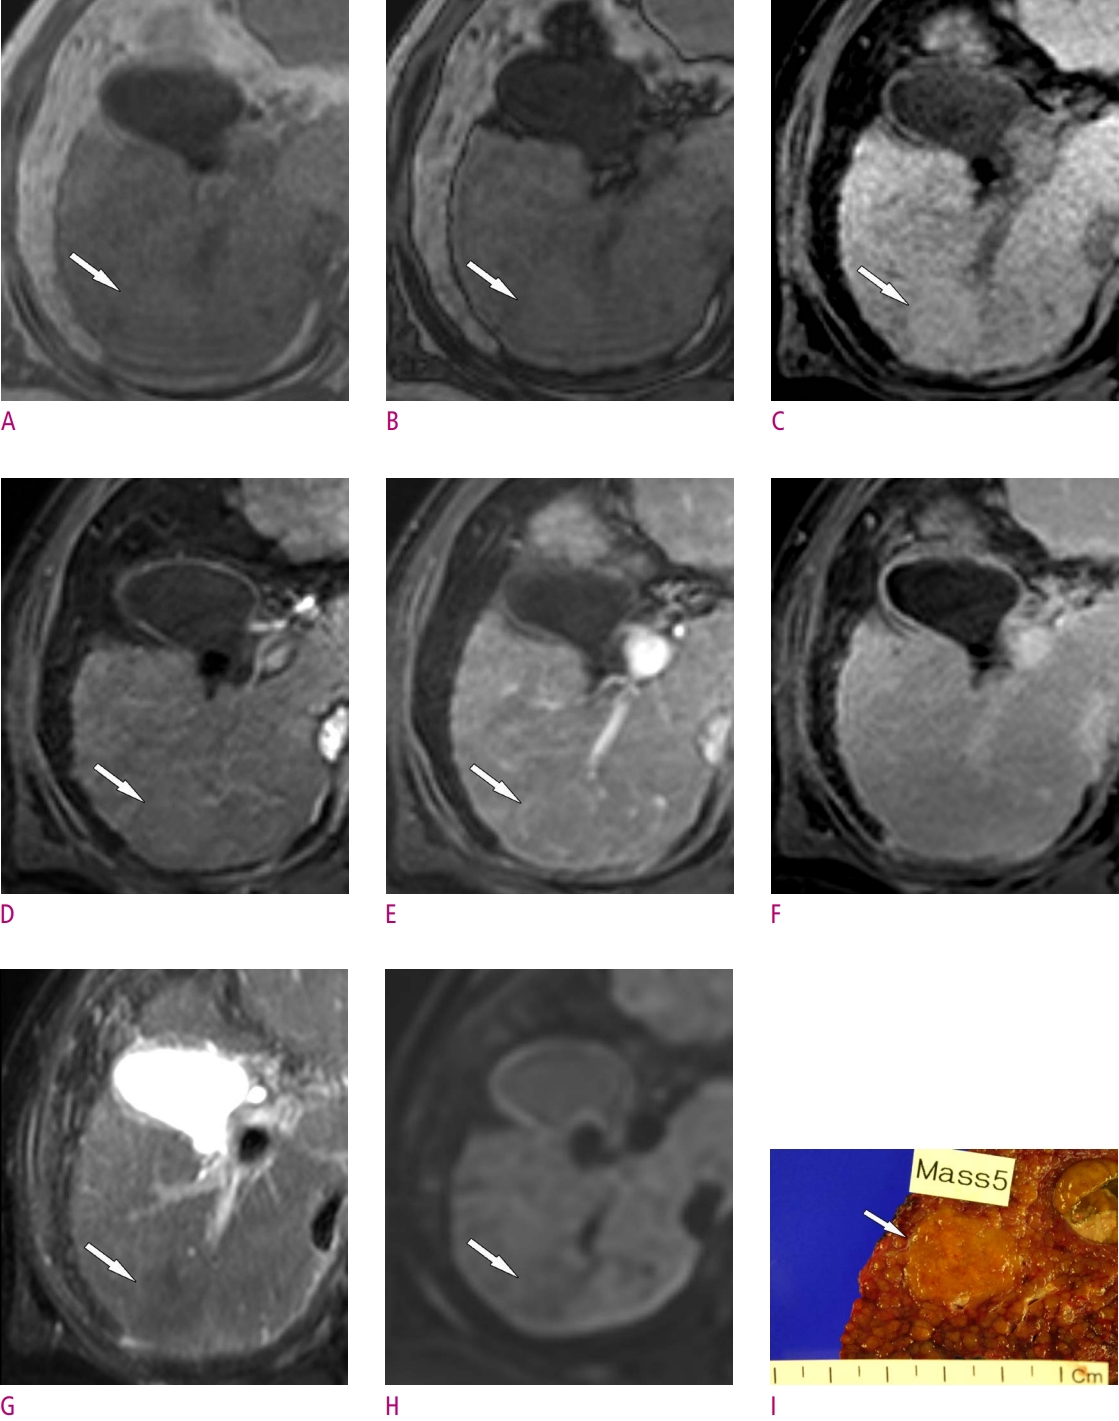
The imaging features of eHCCs on EOB-MRI and DWI are presented in Table 2 and Figs. 2-4. The imaging features of undetected eHCCs (n = 38) were regarded to show negative findings or isointense SI. Fatty change was noted in 29% of detected (n = 135) and 23% of total (n = 173) eHCCs. Most eHCCs showed hypointensity on HBP (90% and 71% of detected and total eHCCs, respectively), while most detected eHCCs showed isointensity on T1WI (59%) and T2WI (66%). Arterial phase hyperenhancement was present in 50% and 39% of detected and total eHCCs, respectively. Washout and capsule appearance in the dynamic phase were observed in 59% and 8% of detected eHCCs, and 46% and 6% of total eHCCs, respectively. Diffusion restriction was observed in 22% and 17% of detected and total eHCCs, respectively. Among the 30 eHCCs showing diffusion restriction, 29 (97%) showed APHE. The interobserver agreement of MRI findings was good to excellent (κ, 0.716-0.894).
Factors associated with the false-negative detection of early hepatocellular carcinoma
Factors affecting the detection of eHCCs are given in Table 3. Univariate analysis showed that history of HCC treatment, type of surgery, number of total HCCs and eHCCs, EnQS, FLIS, and quality of T2WI were significant factors affecting the detection of eHCCs. Multivariate analysis revealed that history of HCC treatment (odds ratio, 0.34 [95% CI, 0.31-0.92], number of total HCCs (≥ 2; odds ratio, 0.08 [0.01-0.66]), and poor FLIS (< 4; odds ratio, 0.13 [0.04-0.51]) were independent factors negatively affecting the detection of eHCCs.
Discussion
Our results showed per-patient and per-lesion sensitivities for the detection of eHCCs of 66% and 68% on the prospective interpretation and 77% and 78% on the retrospective analysis of EOB-MRI. Early HCC on retrospectively analysis was most commonly depicted by HBP hypointensity (90%), with more common presentation of APHE (50%) and washout appearance (59%) than fatty change (29%), diffusion restriction (22%), and capsule appearance (8%). False-negative detection of eHCCs was associated with lesion size, history of HCC treatment, number of HCCs, and the degree of hepatobiliary enhancement.
Our study demonstrates the usefulness of HBP of EOB-MRI for detecting eHCCs as hypointensity. In our series, 90% and 71% of identifiable and total eHCCs showed HBP hypointensity, respectively; comparable with Sano et al. [15] and Kim et al. [17] (97% and 76%, respectively). The high sensitivity of HBP hypointensity for detecting eHCC may be explained by the decrease in OATP8 expression occurring prior to hemodynamic alteration, such as neoarterialization or reduced portal blood flow [15, 17, 32].
Interestingly, in our series, 50% and 39% of detected and total eHCCs showed APHE, compared to just 29% and 13% of total eHCCs reported by Kim et al. [17] and Sano et al. [15], respectively. Additionally, fatty change was less common (29%) in our study than reported by Sano et al (53%) [15]. This discrepancy may be attributed to the different diagnostic criteria applied by pathologists across institutions. We only included the surgically resected lesions determined as eHCC by an expert pathologist, based on the established histological criteria [6, 26]. Therefore, our results indicate that eHCCs may also show hypervascularization detectable on EOB-MRI. In our experience, EOB-MRI may be advantageous for identifying APHE in eHCCs, by demonstrating HBP hypointensity, making it easier to match small arterially hyperenhancing lesions with true lesions. Conversely, on CT or extracellular agent-enhanced MRI, subtle hyperenhancing lesions may be considered pseudolesions, because they frequently show isoattenuation or isointensity on late dynamic images.
Our results showed diffusion restriction in just 22% of the detected lesions, comparable with 21% in a study by Kim et al. [17]. Moreover, diffusion restriction was seen in only one eHCC without APHE, suggesting that there is limited additional value in using DWI for detecting eHCC. Notably, in our series, capsule appearance was present in 8% of eHCCs, similar to a previous report (9.5%, 4/42) [17]. The presence of capsule appearance on EOB-MRI might be extraordinary because eHCCs are, histologically, vaguely nodular tumors with indistinct margins, lacking a tumor capsule [33]. However, in the setting of advanced cirrhosis such as explanted livers, eHCC may show a more distinctly nodular appearance because of surrounding cirrhotic septa, not tumor capsule [3, 34, 35]. Therefore, the capsule appearance on EOB-MRI may be indicative of a pseudocapsule, caused by the retention of contrast material at lesion margins [30]. In addition, eHCCs frequently showed well-defined margins on MRI, especially on HBP images, probably because of the higher tissue contrast on these images.
Strengths of our study include both the prospective and retrospective evaluation of eHCC detection sensitivity. In the prospectively acquired data from preoperative MRI reports, approximately 10% (17/173) of lesions were missed compared with that in retrospective review, which may reflect more realistic data. The retrospective per-lesion detection sensitivity (78%) in our study was comparable to that in a recent study by Kim et al. (71-79%) based on retrospective analysis [17].
We also evaluated factors related to the failure of preoperative detection. First, as expected, false-negative detection was affected by lesion size; eHCCs < 1 cm (21/56 [37%]) were not preoperatively identified, comprising 55% (21/38) of the total false-negative results. Comparatively, only 3% (1/38) of false-negative detection occurred in eHCCs ≥ 2 cm. Second, a history of HCC treatment increased the false-negative detection of eHCCs, probably due to hemodynamic alteration or parenchymal architectural distortion of the liver associated with treatment. Third, the higher false-negative detection rate in patients with multiple HCCs may be attributed to the satisfaction of search error [36, 37]. Finally, the quality of HBP enhancement (determined by FLIS) was independently associated with the false-negative detection of eHCCs. Given that the most sensitive imaging feature for the detection of eHCCs was HBP hypointensity, it may be expected that poor HBP quality leads to false-negative detection. Conversely, other laboratory or clinical parameters of hepatic function (including Child-Pugh class or ALBI grade), image quality of T2WI, DWI, and dynamic imaging were not independent factors associated with the false-negative detection of eHCCs on multivariate analysis.
This study also has limitations. First, it may have inherent selection bias due to the retrospective design. For example, as we only included patients who underwent surgical resection, their hepatic function was relatively good, possibly limiting evaluation of the association between hepatic function and false-negative detection. Second, calculation of prospective eHCC detection sensitivity was based on original radiological reports; however, this approach may have provided more realistic results compared to those based on just retrospective review. Third, although the whole liver was available as a reference standard in transplanted patients, the remnant liver in the resection group could not be evaluated. Finally, despite extensive efforts to correlate preoperative MRI with pathological specimens, accurate lesion-by-lesion matching was occasionally difficult, especially for explanted livers.
In conclusion, our study showed that histologically defined eHCCs are most commonly seen as HBP hypointensity. Arterial phase hyperenhancement and washout appearance are seen more frequently than fatty change, diffusion restriction, and capsule appearance. Detection sensitivity may be affected by lesion size, history of HCC treatment, number of HCCs, and hepatobiliary enhancement.
 PDF Links
 PubReader
 ePub Link
 Full text via DOI
 Download Citation
 Print
Print