


Introduction
Although gastric subepithelial tumors (SETs) are considered “rare”, they are quite frequently detected incidentally during esophagogastroduodenoscopy [1, 2]. Gastric SETs include a wide variety of benign, premalignant, and malignant lesions. They can be classified into four main subtypes according to their origin; true smooth muscle tumors (leiomyomas, leiomyosarcomas, glomus tumors), neurogenic tumors (schwannomas, neurofibromas, ganglioneuromas, paragangliomas), fibroblastic tumors (desmoid, inflammatory myofibroblastic tumors), and gastrointestinal stromal tumors (GISTs) [3]. With the exception of very rare leiomyosarcomas, all gastric mesenchymal tumors other than GISTs are almost always benign. GISTs however—even when they are small—are potentially malignant [4, 5]. Therefore, accurate differentiation of GISTs from other benign SETs is crucial for management planning and predicting prognoses.
According to several previous reports, computed tomography (CT) findings including non-cardial location, heterogeneous enhancement, presence of necrosis, larger lesion size, and absence of lymphadenopathy are highly suggestive of large GISTs (≥ 5 cm), as opposed to schwannomas or leiomyomas [3, 6, 7]. GISTs can sometimes manifest as well-defined masses with homogenous low attenuation in the cardial area, particularly if they are small (< 5 cm), rendering differentiation from leiomyoma or schwannoma challenging.
Advances in multidetector CT have resulted in the development of perfusion CT (PCT) as an attractive imaging modality that can determine tissue perfusion characteristics in various types of solid organ and hollow viscus tumors [8-11]. Several recent studies have reported that PCT of gastric cancer is feasible, and gastric cancer perfusion parameters obtained from PCT data provide information on tumor vascularity and angiogenesis, making histologic differentiation and treatment monitoring with PCT possible [11-13]. However, the differentiation of GISTs from other benign SETs using tumor perfusion parameters obtained via PCT has not been investigated. In the current prospective study, we investigated whether the perfusion parameters of gastric SETs obtained via PCT could provide useful information for differentiating between GISTs and non-GISTs in the stomach.
Materials and Methods
This prospective observational study included patients suspected of having gastric SETs attending an academic medical center from December 2017 to July 2018. The study was compliant with the Health Insurance Portability and Accountability Act and was approved by the appropriate institutional review board. Written informed consent was obtained from all subjects.
Study population
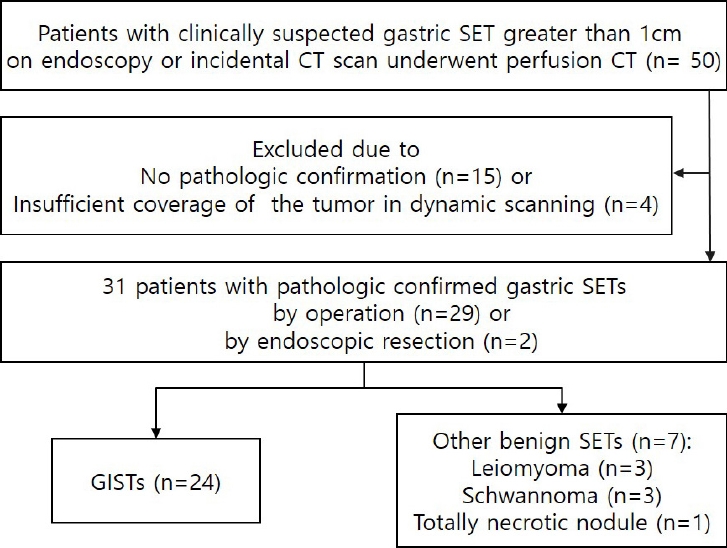
Fifty patients with a clinically suspected gastric SET greater than 1 cm in size as determined via endoscopy or incidental CT scanning were prospectively recruited at our institute. All patients underwent PCT. Of the 50 patients, 35 gastric SETs were pathologically confirmed via surgery (n = 34) or endoscopic resection (n = 1). Of these 35 patients, 4 with insufficient coverage of the tumor in dynamic scanning were excluded, therefore a total of 31 patients were ultimately included in further image analyses (Fig. 1). They consisted of 5 men and 26 women, with a mean age of 60.8 years (range 27-85 years). Twenty-nine underwent gastric wedge resection, and the remaining 2 underwent subtotal gastrectomy.
CT protocols
CT scans were performed with a 64-channel multidetector CT scanner (SOMATOM Definition, Siemens Healthcare, Forchheim, Germany). Before CT scanning, all patients were asked to drink 1 L of water to distend the stomach. No anti-peristaltic agent was used. After a baseline non-enhanced scan covering the distended stomach, which was identified on a topogram, dynamic scanning for the target gastric lesion with a limited scanning range of 17.6 cm was conducted. In each patient, 50 mL of iodinate contrast agent (Bonorex 350; Central Medical Service, Seoul, Korea) was injected into an antecubital vein at a flow rate of 5 mL/sec followed by 50 mL of saline at the same flow rate. Seven seconds after the injection of contrast material, 15 spiral acquisitions were performed in four-dimensional spiral mode with a variable pitch. Images were acquired with a scanning time of 1.5 sec per spiral and a cycle time of 3 sec, resulting in a total examination time of 46 sec. Additional scanning parameters were tube voltage 80 kVp, tube currenttime product 150 mAs, and section collimation 64 × 1.2 mm with a z-flying focal spot. Patients were instructed to breathe shallowly throughout the scanning. PCT images were reconstructed with a section thickness of 3 mm (increment 2 mm) using a medium-smooth tissue convolution kernel (B20f). Radiation dose parameters derived from the electronically logged patient protocol included a volume CT dose index of 75.76 mGy, and a dose-length product of 911 mGy·cm. The total effective dose for perfusion scanning was 13.6 mSv with a conversion factor of 0.015 mSv/mGy·cm. Dynamic perfusion scanning was followed by a conventional contrast-enhanced portal phase CT extending from the liver dome to the lower margin of the symphysis pubis 60 sec after the administration of an additional 1.2 mL/kg of contrast agent. The total effective dose of the entire CT protocol was 21-29 mSv.
Image analysis
Baseline characteristics including age, sex, and clinical symptoms were obtained from the patients’ electronic medical records. Tumor location and size were assessed via operative and/or endoscopic methods. Two radiologists (S.C.H. and S.H.K.) evaluated conventional CT features of the lesions pertaining to enhancement pattern (homogenous vs. heterogeneous), degree (low, iso, or high), shape (endophytic, exophytic, or dumbbell), margin (smooth or lobulated), enhancement of overlying mucosa, lymph node (LN) enlargement, and the presence of necrosis and calcification on portal venous CT, via consensus. The degree of lesion enhancement was compared with that of adjacent normal gastric mucosa. For the LN enlargement, we used a cut-off value of 8mm in short diameter.
Dedicated software (Syngo.via, VA 36A; Siemens) and an application (CT Body Perfusion in Syngo.via) were used for the quantitative analysis of PCT data. An integrated motion-correction algorithm using a non-rigid registration method was applied [14], then peak arterial enhancement was measured in a circular region of interest (ROI) placed in the suprarenal abdominal aorta. Lesion perfusion was calculated using a maximal slope and delayed Patlak models yielding blood flow (BF, mL/100 g/min), blood volume (BV, mL/100 g/min), mean transit time (MTT, sec), and permeability surface value (PS, mL/100 g/min).
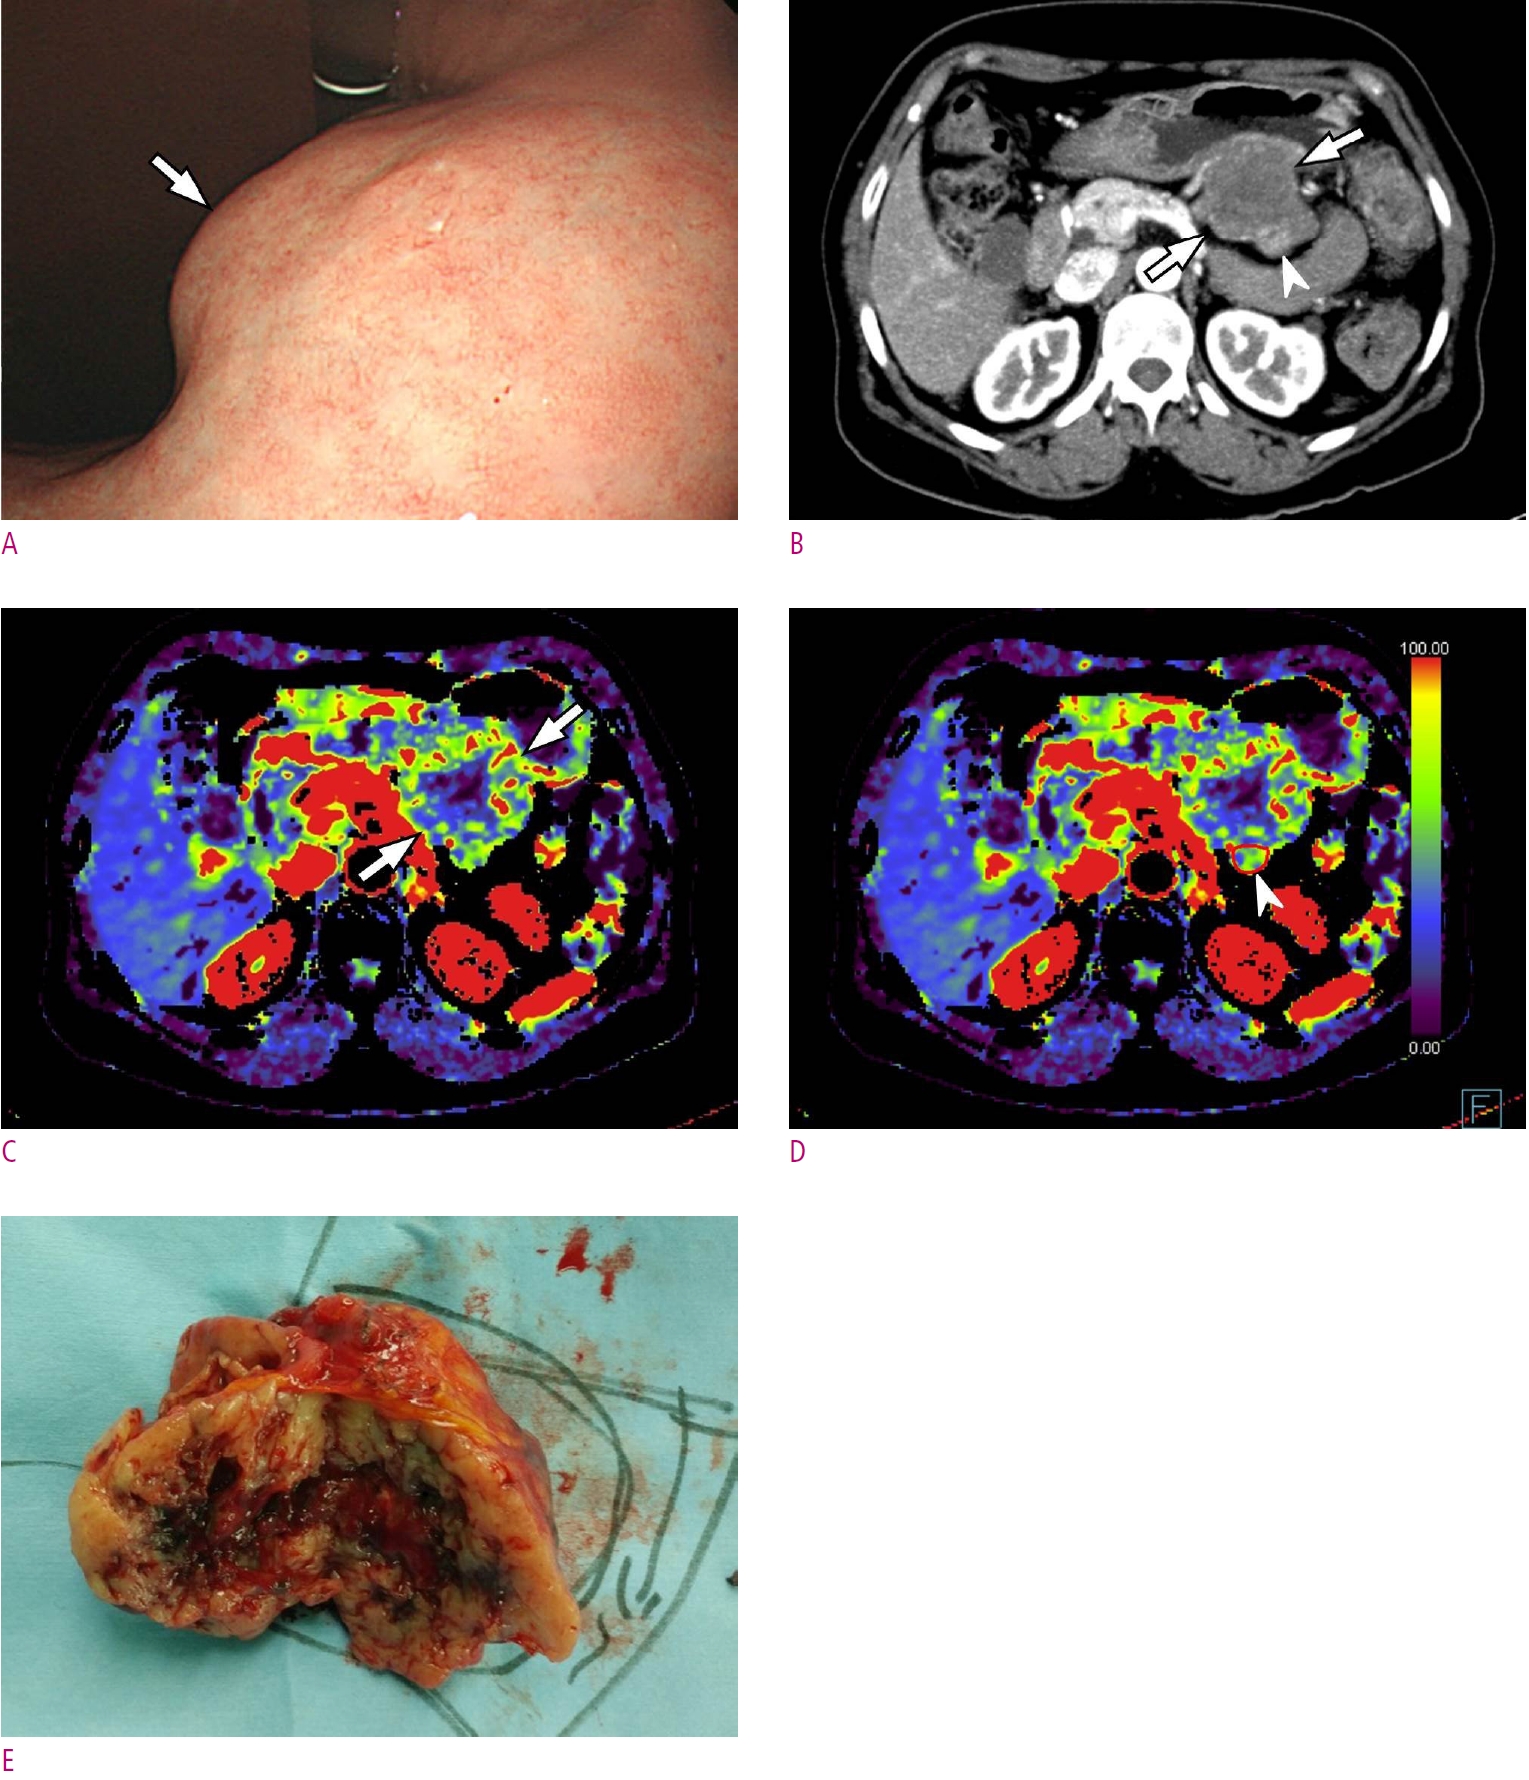
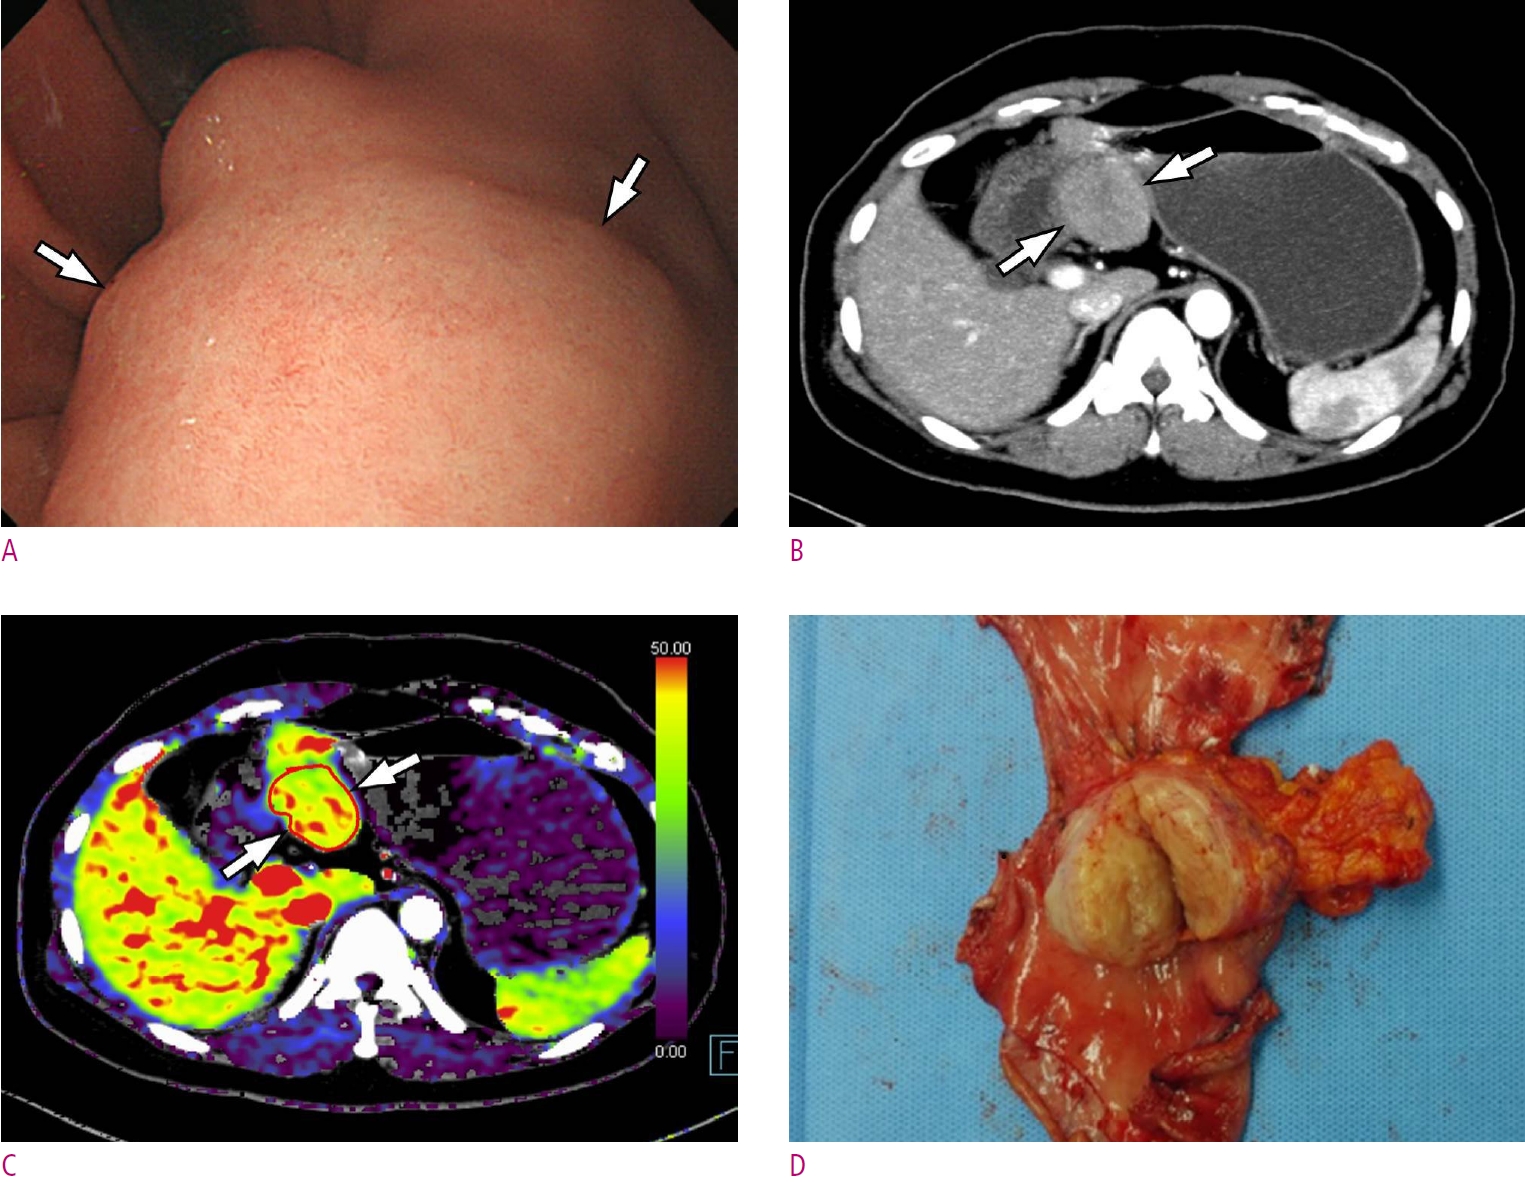
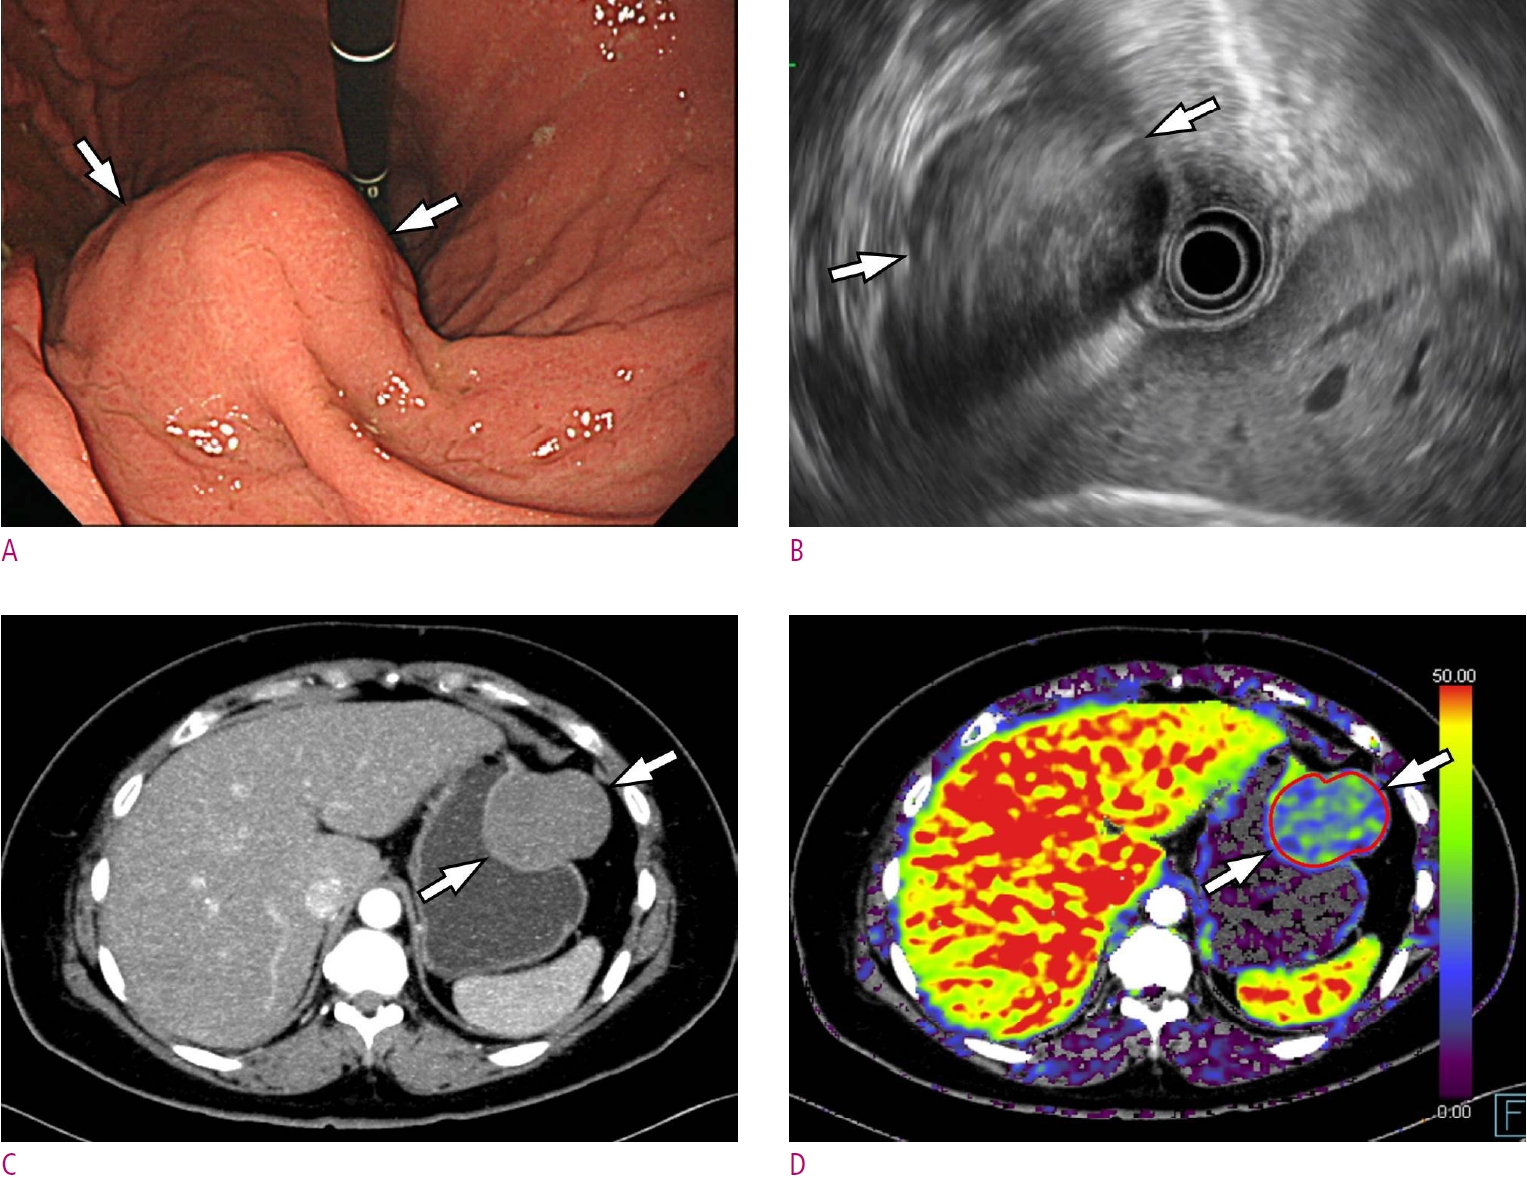
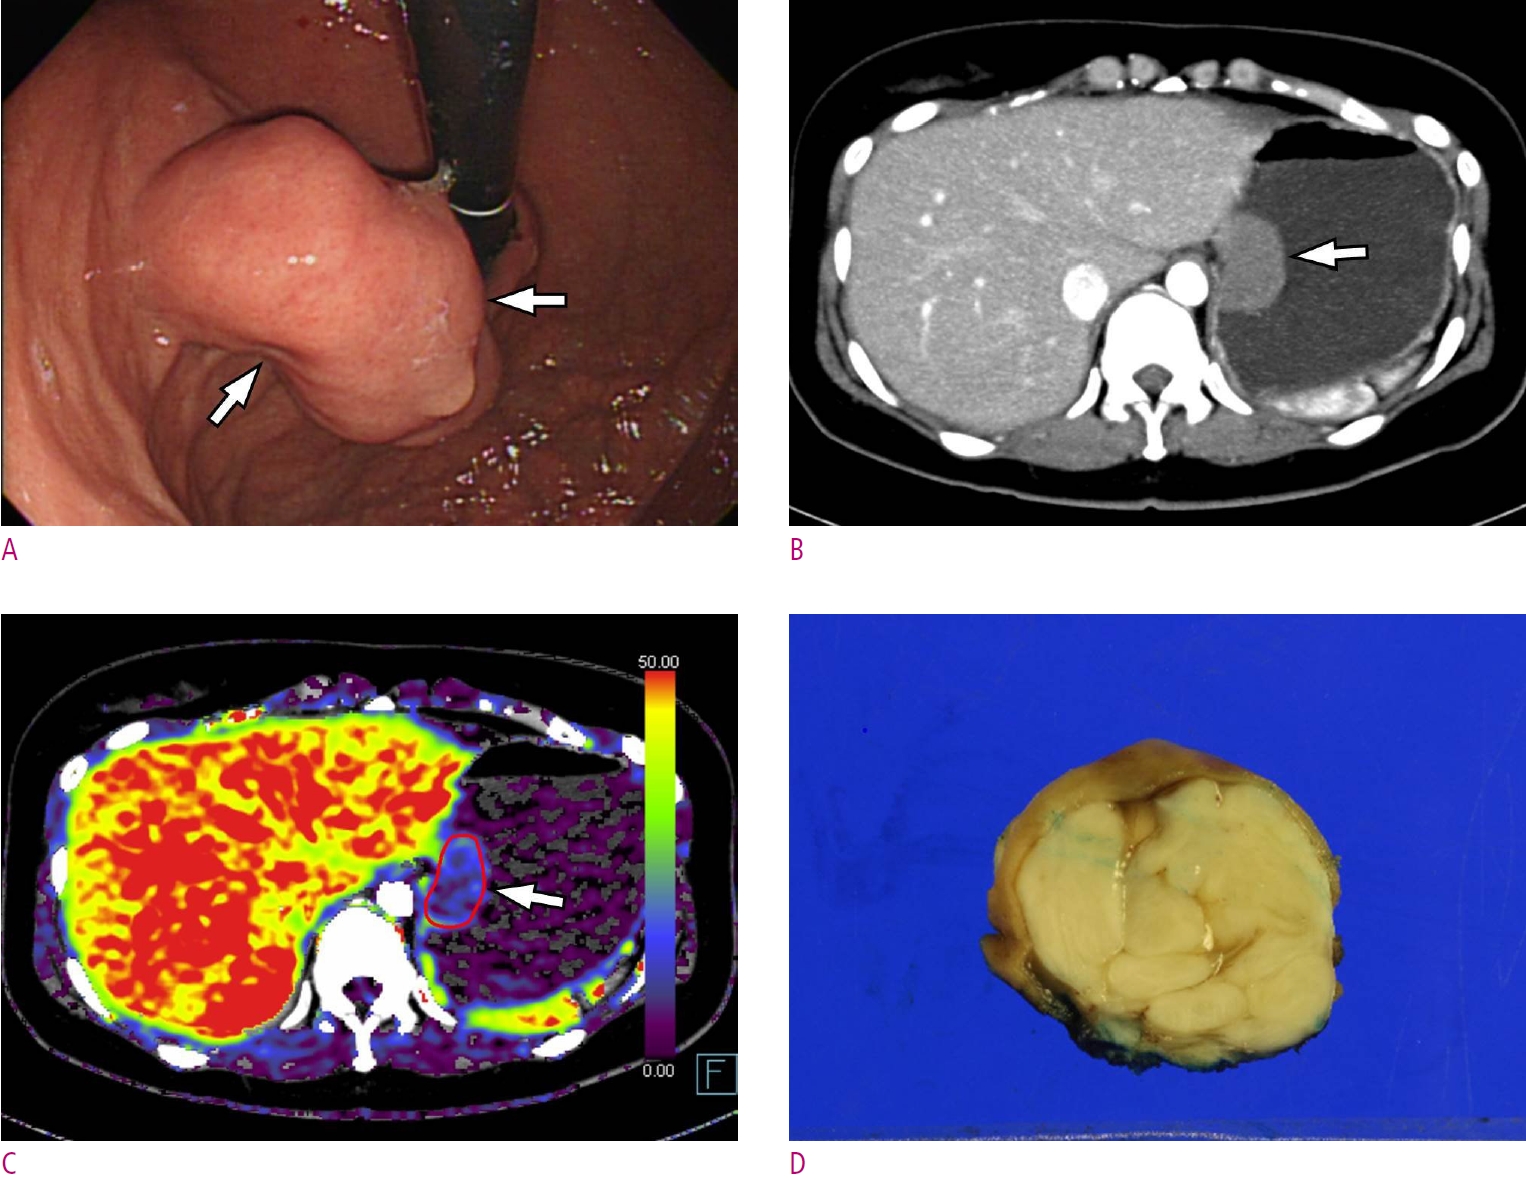
Two blinded and independent radiologists (S.C.H. with 3 years of experience in radiology and D.H.L. with 11 years of experience) identified the gastric lesions and manually drew ROIs over the corresponding areas freehand. The a priori consensus was to draw ROIs on an axial section where the gastric lesion was depicted with the best quality. ROI drawing was done for the entire tumor and for the portion exhibiting the strongest enhancement, avoiding the inclusion of extra-lesional fluid or air (Figs. 2, 3).
Statistical analysis
Continuous variables were expressed as means ± standard deviation, and categorical variables as frequencies or percentages. Data-sets were assessed for normality of distribution using the Shapiro-Wilk test. The chi-square or Fisher’s exact test were used to assess the significance of differences in categorical variables between GISTs and non-GISTs, and the Mann-Whitney U test or Student’s t-test were used to compare continuous variables. To determine inter-reader agreement for the CT perfusion parameter measurements, intraclass correlation coefficients (ICCs) were calculated for each pair of variables. We considered ICC values greater than 0.81 to represent nearly perfect agreement, and values of 0.61-0.80, 0.41-0.60, and 0.21-0.40 representative of substantial, moderate, and fair agreement, respectively. Values less than 0.21 were considered to indicate slight agreement [15]. We also assessed the accuracy of parameters by calculating the non-parametric area under the receiver-operating characteristic (ROC) curve (AUC) with 95% confidence intervals (CI). All statistical analyses were performed using SPSS software (version 22; SPSS Inc., Chicago, Illinois), and p < 0.05 was considered statistically significant.
Results
Baseline characteristics
Among the 31 cases, 24 were histologically confirmed as GISTs (4, no risk of malignancy; 11, very low risk; 2, low risk; 5, intermediate risk; and 2, high risk) and 7 were confirmed as benign non-GISTs (3 leiomyomas, 3 schwannomas, and 1 totally necrotic nodule). GISTs were further subcategorized into a no risk to low risk group (including no risk, very low risk, and low risk GISTs) and an intermediate to high risk group (including intermediate risk and high risk GISTs). The malignant potential of GISTs was assessed as very low, low, intermediate, or high on the basis of their mitotic index and size, according to the revised National Institutes of Health consensus criteria (the Joensuu risk criteria) [15]. The majority of the tumors were longitudinally located in the upper body (11/31; 35.5%) and transversely located at the anterior wall and greater curvature of the stomach (9/31; 29.0% each). The median tumor size was 2.8 cm (range 1.5-8.0 cm). There were no significant differences in baseline characteristics between the GIST and non-GIST groups (Table 1).
Conventional CT features
In univariate analysis, the non-GIST group exhibited a high proportion of LN enlargement (28.6% vs. 0%, p = 0.045), and all the positive cases were confirmed as schwannomas. There were no other statistically significant differences in CT features between the two groups (Table 2). Among the 24 GISTs, 17 were assigned to the no risk to low risk group and the remaining 7 were assigned to the intermediate to high risk group, and there were no significant differences in any conventional CT features between these two groups.
CT perfusion parameters
Among the perfusion parameters, the mean PS in the most strongly enhanced area of GISTs (25.3 ± 23.9 mL/100 g/min) was significantly higher than that of other benign SETs (8.8 ± 8.8 mL/100 g/min) (p = 0.029). There were no significant differences in any other CT perfusion parameters (Figs. 2-5) (Table 3). There were also no significant differences in perfusion parameters between the no risk to low risk GIST group and the intermediate to high risk GIST group.
ICCs indicated nearly perfect reliability for most of the CT perfusion parameters with regard to the entire tumor, except for MTT, which exhibited moderate reliability (BF 0.928, 95% CI 0.853 to 0.965; BV 0.911, 95% CI 0.814 to 0.957; PS 0.953, 95% CI 0.902 to 0.977; MTT 0.468, 95% CI -0.118 to 0.745). For the areas of strongest enhancement, BF and BV ICCs also indicated nearly perfect reliability (BF 0.933, 95% CI 0.861 to 0.968; BV 0.949, 95% CI 0.896 to 0.976). However, PS and MTT ICCs indicated moderate reliability (PS 0.531, 95% CI 0.016 to 0.775; MTT 0.542, 95% CI 0.044 to 0.780) [16].
In ROC analysis of PS in the areas of strongest enhancement, the AUC was 0.774 ± 0.211 (p = 0.03), and sensitivity was 91.7% (22/24) and specificity was 57.1% (4/7) with regard to the diagnosis of GISTs when the PS cut-off value was set at 7.17 mL/100 g/min (Fig. 6).
Discussion
In the current study, PS in the areas of strongest enhancement of GISTs was an independently significant CT perfusion parameter with respect to differentiating GISTs from other benign SETs. More specifically, the mean PS of GISTs in the areas of strongest enhancement (25.3 ± 23.9 mL/100 g/min) was significantly higher than that of non-GISTs (8.8 ± 8.8 mL/100 g/min). In addition, although the difference was not statistically significant, BF and BV of GISTs tended to be greater than those of non- GISTs. These results were concordant with previous reports [17, 18]. In several previous studies, over-expression of angiogenesis-related factors such as vascular endothelial growth factor and hypoxia-inducible factor 1 alpha was detected in GISTs [17, 18]. Furthermore, given the malignant potential of GISTs they may contain more leaky vessels than other benign SETs, leading to higher PS because—theoretically—PS represents the flux of plasma from the intravascular interstitial space to the extravascular interstitial space [9, 13]. Therefore, the different microvasculature and vessel permeability of GISTs may be responsible for the higher perfusion values they exhibit compared to non-GISTs.
Other than CT perfusion values, LN enlargement was the only significant conventional CT feature pertaining to differentiation between GISTs and non-GISTs. None of the GISTs were associated with lymphadenopathy, whereas 2 of the 7 benign SETs were associated with LN enlargement. Both of these lesions were confirmed to be schwannomas. This result is also concordant with previous reports [3, 6]. According to Choi et al. [3], gastric schwannomas tend to be associated with LN enlargement. Though the precise pathophysiological mechanisms involved in the frequent lymphadenopathy associated with schwannoma have not been investigated, the authors assume that a lymphophilic cytokine or cytokines may induce LN enlargement in this context because schwannoma is frequently accompanied by perilesional lymphoid cuffing at the periphery of the lesion [3]. Therefore, we believe that the combined use of the presence of LN enlargement and lower PS value may increase the accuracy of gastric schwannoma diagnosis.
Contrary to our expectation that greater malignant potential in high-risk GISTs may result in higher perfusion values than in low-risk GISTs, there were no significant differences in CT perfusion parameters or conventional CT features between high-risk and low-risk GISTs. The small sample sizes in the study may have been responsible for these non-significant results. A future study including a large number of patients is required, to clarify these unexpected results.
High inter-observer and intra-observer variability are known limitations of the utilization of CT to investigate perfusion. In the present study however, ICC values for CT perfusion parameters between the two assessors were high, indicating near perfect or moderate reliability. We believe that the use of a motion correction algorithm may be responsible for such high reproducibility of CT perfusion values. Because the determination of perfusion via CT requires a long image acquisition time, the use of a motion correction algorithm could be considered essential. Goetti et al. [19] reported that without a motion correction algorithm quantitative assessment was impossible due to respiratory motion in approximately 30% of patients with liver lesions.
The current study had several limitations. The most limiting factors were that it was a single-center study and it only included a small number of participants (N = 31). However, we believe that the number of patients may be sufficient for a preliminary study investigating the use of PCT for the differentiation of gastric SETs. Although not significant in the present study, the higher values for most of the CT perfusion parameters in the GIST group is promising, and emphasizes the need for a multi-center study with a larger number of patients. Another limitation was reliance on the radiologist’s subjective opinion with regard to the area with the strongest enhancement, which may have led to reduced reproducibility. Notably in this respect, the ICC of the PS of the area of strongest enhancement was lower than the ICC of the PS of the entire tumor. Lastly, despite the availability of various analytical systems for determining perfusion via CT, the present study was conducted with only one model from one manufacturer. Because our results were based on the delayed Patlak and maximum slope models, other analytical methods such as deconvolutional models may yield different results [20, 21].
In conclusion, perfusion parameters determined via PCT in patients with gastric SET were useful for the differentiation of GISTs from other benign SETs, as PS values in GISTs were significantly higher than those of non-GIST SETs.

 PDF Links
 PubReader
 ePub Link
 Full text via DOI
 Download Citation
 Print
Print