


Introduction
Fat-suppression techniques are currently essential in almost all abdominal MRI examinations. The indication for fat-suppressed MRI images can be summarized in terms of three purposes. First, it is possible to significantly reduce chemical shift artifacts that have been increased as high magnetic field strength (3.0 Tesla or higher) instruments become increasingly common. It is also very useful for the visualization of contrast agents in soft tissues containing adipose cells on contrast-enhanced MRI sequences. TP [The presence of fat components is often an important clue in the diagnosis of various pathological conditions in the abdomen and pelvis. Fat-suppressed MRI imaging is thus a valuable tool that can detect intracytoplasmic fat in tissues more sensitively as compared with other modalities such as computed tomography or ultrasound [1].] This is of great help in discriminating liver tumors and diagnosing hepatic steatosis; tumors of the adrenal gland, kidney, or retroperitoneal space; tumors of the ovary; and several hematologic diseases manifesting bone-marrow infiltrations. Lastly, certain fat-suppression techniques can be used to quantify fat, which is especially useful in noninvasive diagnosis and tracking the treatment effectiveness of hepatic steatosis [2]. The article briefly reviews the basic physics needed to understand fat-suppression techniques, explains the background principles inherent with characteristics of several frequently used fat-suppression techniques, and reports a state-of-the-art fat quantification technique using a multipoint Dixon method.
Basic physics
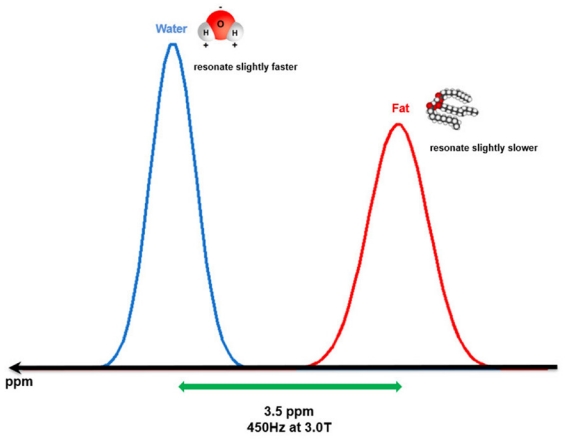
One important cause of why fat and water display fundamentally different behaviors in response to an external magnetic field (e.g., MRI magnet) is that water and fat protons experience different local magnetic environments due to their different molecular structures. Fat protons within multiple long-chain triglycerides are located around electroneutral carbon atoms. This fact allows the electron cloud surrounding these protons to shield them from the full gyromagnetic effect of the external magnetic field, which means that the protons in the fat encounter a slightly weaker local magnetic field and have a relatively lower resonance frequency. On the other hand, the protons of water molecules are located around strong electronegative oxygen atoms, which forcefully pull the electron cloud covering the protons of the water molecules toward them, reducing its capacity to shield them from the gyromagnetic effect of an external magnetic field. This phenomenon is known as the deshielding effect. CME 1c [As a consequence, water protons have a relatively higher resonance frequency than that of fat protons, and the so-called chemical shift is a small difference in resonance frequency between fat and water protons produced by this principle (Fig. 1). However, the difference in frequencies is quite small, approximately 3.5 part per million (ppm). In a 3.0-T MRI machine, the difference can be calculated by multiplying 3.5 ppm with the Larmor frequency (128 MHz) and is about 450 Hz [3].]
Another physical background for fat-suppression techniques is that fat and water protons have different T1 relaxation times. To date, there is no perfect theory to accurately explain and predict the T1 relaxation time in a particular tissue, but several mechanisms known to affect the T1 relaxation time have been identified [4]. These principal relaxation mechanisms include dipole-dipole interaction, chemical shift anisotropy, molecular translation, and chemical exchange. Dipole-dipole interactions are the most important single mechanism for proton relaxation in biological tissues. Among the factors that influence the dipole-dipole interactions, the one most closely related to the T1 relaxation time is the molecular rotational motion. This is usually referred to as the molecular tumbling rate and mathematically defined as the rotational correlation time, which is the time required for molecules to rotate by approximately 1 radian. Molecular rotational motion is faster for molecules that are smaller (due to their lower molecular weight), with less structured shapes (such as free water), and with higher temperatures. The Solomon-Bloembergen equations show that the T1 relaxation time is minimized whenever the molecular rotational motion (rotational correlation time) of a substance matches its Larmor frequency, suggesting that the dipole-dipole interactions are most optimized [5, 6]. Fat molecules are relatively larger in molecular weight and more structured shape than water molecules, so they have a slower molecular rotational motion, which means that they have a rotational correlation time similar to that of the Larmor frequency, thus showing a shorter T1 relaxation time.
Overview of various fat-suppression techniques
A large number of techniques have been developed to suppress fat signals. Various fat-suppression techniques used for abdominal MRI can be classified into three categories: chemical shift-based, inversion-based, and hybrid forms that use both (Fig. 2). Chemical shift-based techniques include chemical shift selective (CHESS), water excitation, and Dixon methods. Among them, the Dixon method has the unique characteristic of that it can be used for fat quantification. CME 2d [Additionally, short tau inversion recovery (STIR) is an inversion-based technique and spectrally adiabatic inversion recovery (SPAIR) is a hybrid technique.]
Chemical shift-based techniques
CHESS
Because of the natural separation of the resonant frequencies of fat and water (i.e., chemical shift), it is possible to saturate fat protons only by applying a fat-selective 90° radiofrequency (RF) pulse with a narrow bandwidth tuned to the center of the fat resonance frequency. Following the application of a 90° fat-selective RF pulse, transverse magnetization of the fat protons is destroyed by a strong spoiler gradient. Eventually, these saturated fat protons are unable to generate MRI signals in subsequent imaging sequences such as spin-echo (SE) or gradient-echo (GRE) sequences (Fig. 3).
TP, CME 3d [CHESS, commonly called fat-saturation imaging (or "fat-sat") is easy to implement and is applicable to almost all imaging sequences [7]. Also, CHESS is the most commonly used technique for suppressing fat signals in T1-weighted, contrast-enhanced MRI [8].] It does not change the T1 contrast of the tissue, unlike STIR, which will be discussed further later. CHESS requires additional preparatory steps, such as fat-selective saturation RF pulsation and the spoiler gradient, which increase the overall scan time. However, some MRI systems support the technique (e.g., Quick FatSat, Siemens Helthineers) in a manner that shortens the total scan time by applying it more sparsely instead of deploying a fat-selective RF pulse at every repetition time (TR) interval.
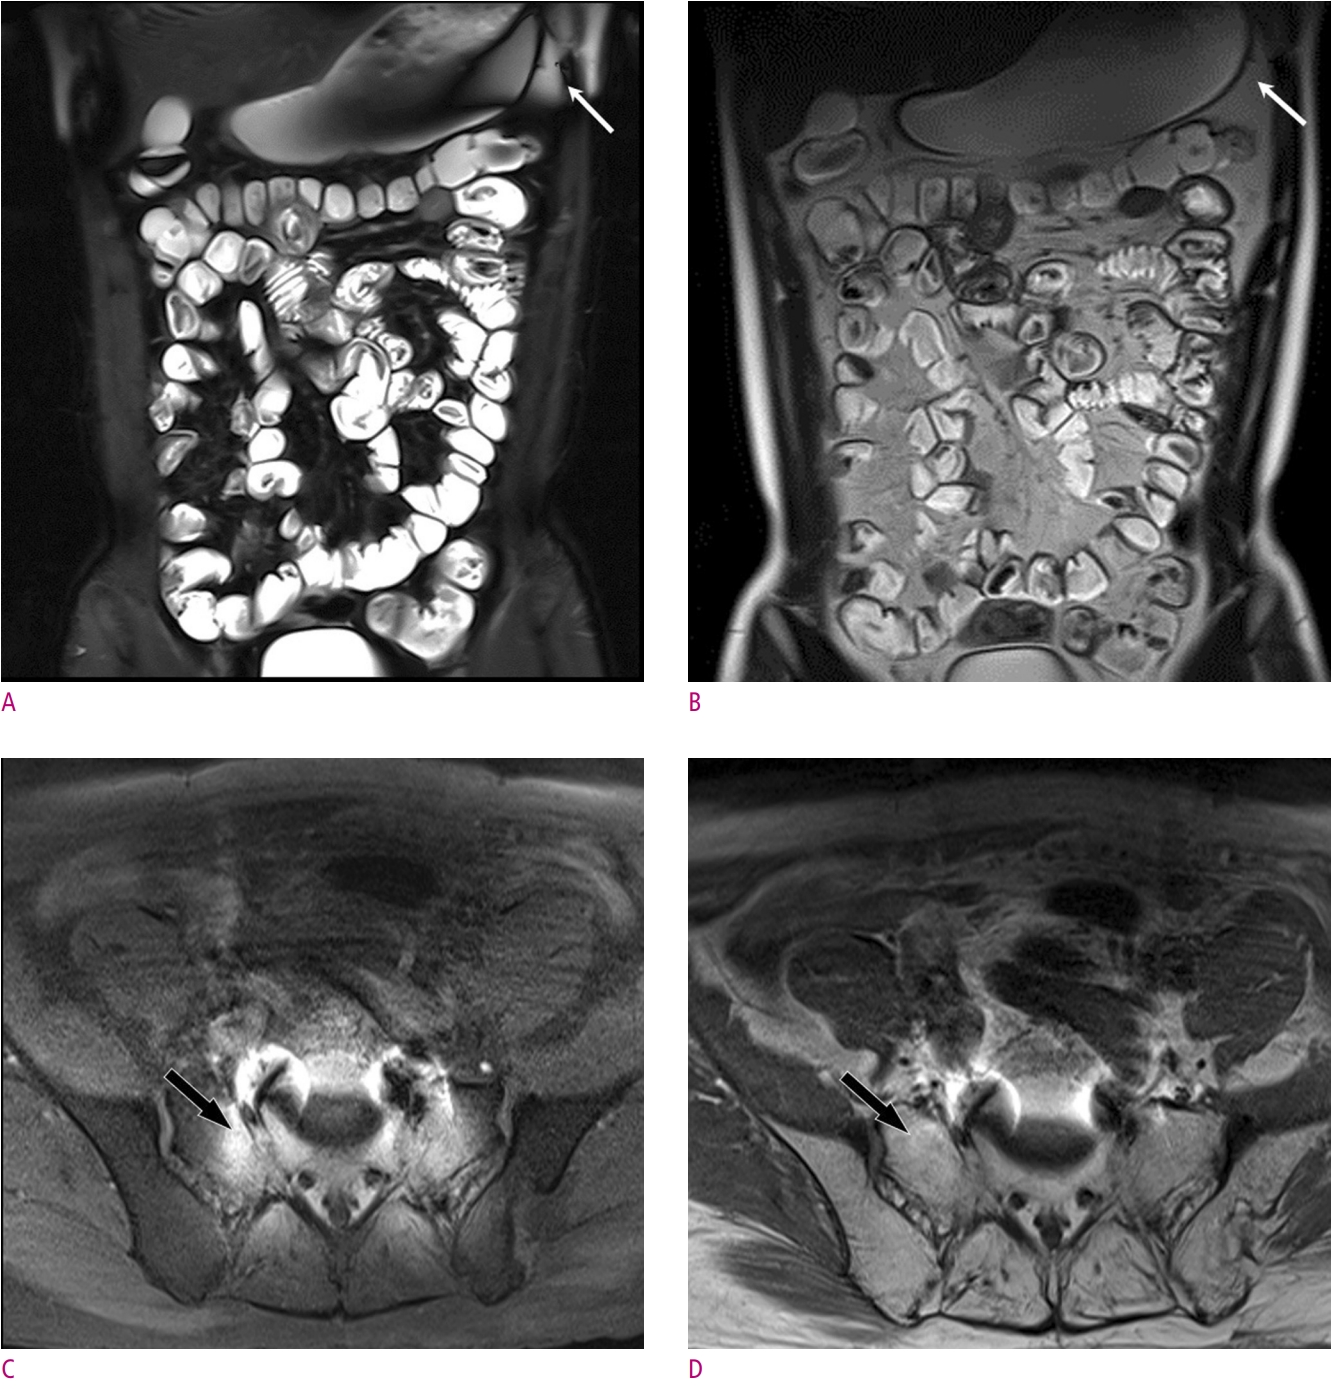
The biggest disadvantage of CHESS is that its performance is greatly influenced by the strength and homogeneity of the main magnetic field. As shown above, the difference in resonance frequency between water and fat protons is proportional to the strength of the main magnetic field. If the main magnetic field is too weak, then the efficiency of selectively saturating only fat protons using narrow bandwidth RF pulses markedly decreases or even becomes to do impossible. The main magnetic field homogeneity also influences successful fat suppression. On fat-suppressed MRI scans with CHESS, it is common to see that fat suppression has failed around metallic substances and at the tissue interfaces with large differences in magnetic susceptibility (Fig. 4). Strategies for limiting main magnetic field inhomogeneity include using a smaller field of view to exclude areas of inhomogeneity and altering the external magnetic field (i.e., shimming) to counteract internal field inhomogeneity. CHESS is also affected by the inhomogeneity of the RF pulse field, which is also known as B1 field inhomogeneity. If the fat-selective RF pulse is inhomogeneous, poor fat suppression and even water suppression may result [8].
Water excitation
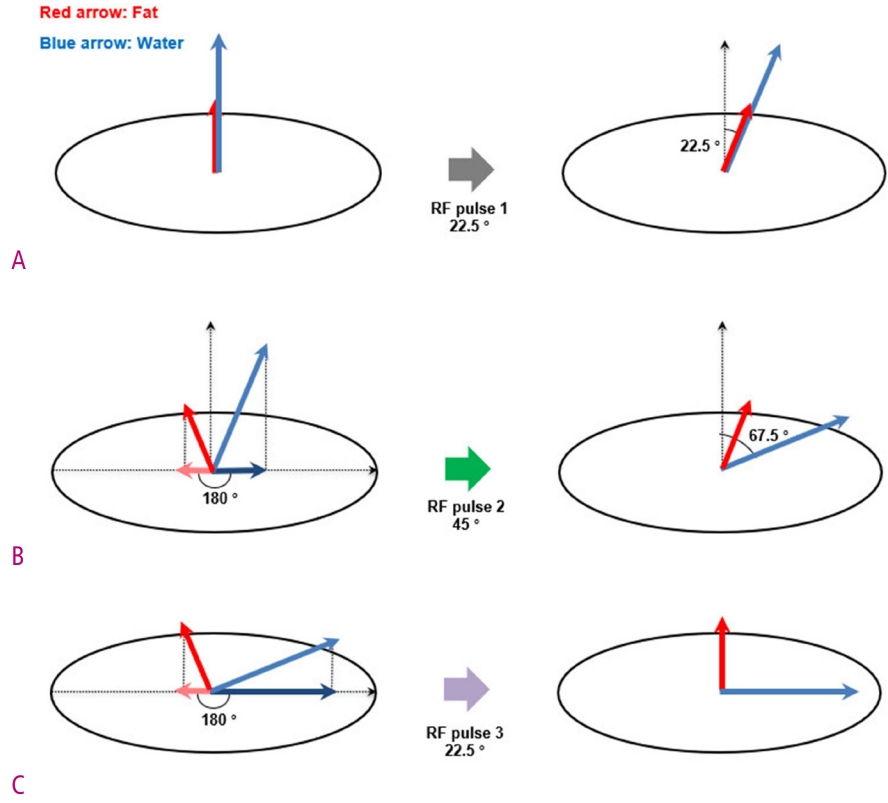
Based on the use of chemically selective RF pulses, water excitation is a method of selectively stimulating water protons, unlike CHESS, which saturate fat protons only [9]. Water excitation is also referred to as spectral-spatial imaging because it consists of selective excitations of both the spectral band and the spatial region [7]. There are several interesting routes by which the water-excitation technique excites only water protons. It uses binomial pulses, which involve flipping the angles following the pattern of coefficients of the binomial expansion of (a+b)n, instead of a 90° fat-selective RF pulse. Any combination whose ratios satisfy the binomial pattern and add up to 90º will operate to selectively excite water protons and leave the fat resonance unchanged. The most commonly used binomial pulse is a 1-2-1 triplet (22.5°-45°-22.5°). This does not require a spoiler gradient for dephasing the transverse magnetization of fat protons.
A detailed implementation is illustrated in Fig. 5. First, there is an initial excitation of 22.5° RF pulse applied to both the fat and water. After a short waiting period, there comes a point at which a phase difference of 180° occurs in the transverse magnetization due to the different resonant frequencies of fat and water. The 45° excitation angle then tips the magnetization of water protons to 67.5° with respect to the longitudinal direction, whereas the magnetization of fat protons is flipped to 22.5° in the same direction. After the second waiting time, a 22.5° RF pulse completes the 90° transverse magnetization of the water protons, and the fat protons return to the longitudinal position and thus do not contribute to the MRI signal. The water-excitation technique is also sensitive to the main magnetic field inhomogeneity, yet is strongly insensitive to B1 field inhomogeneity because its nulling of fat signals is implemented by the timing of interpulse delays that allow it to avoid incomplete fat suppression linked to B1 field inhomogeneity [10].
The Dixon method
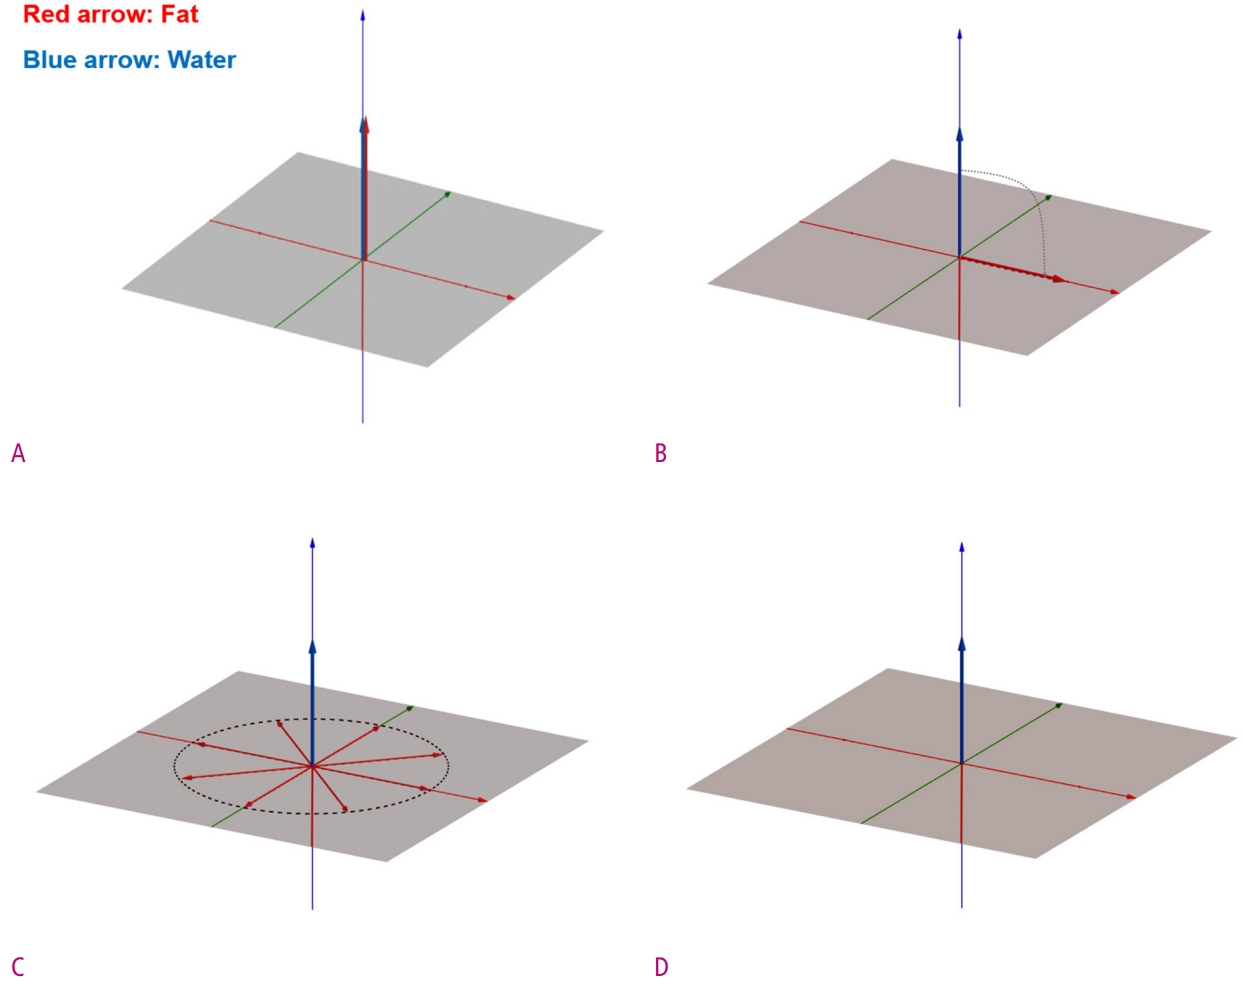
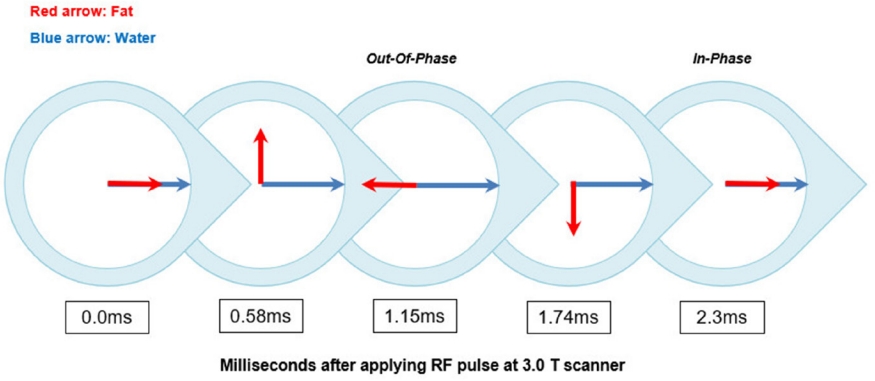
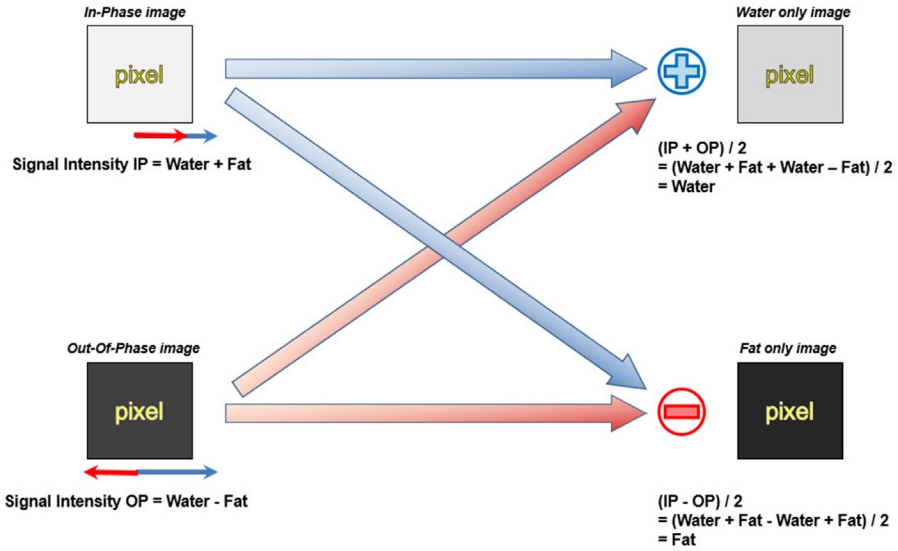
First proposed by Dixon in 1984 [11], the Dixon method encompasses a group of chemical shift-based techniques using the in-phase (IP)/out-of-phase (OP) cycling of fat and water. Water and fat protons have different resonance frequencies (i.e., chemical shift), and the phase difference of their transverse magnetization changes periodically over time. Hence, these two transverse magnetization vectors point in the same direction (IP, phase difference is 0°) or in the opposite direction (OP, phase difference is 180°) at each specific interval (Fig. 6). Given a water-fat resonance frequency difference of 450 Hz inherent with the 3.0-T machine, the water and fat protons will be IP every 2.3 ms. The basic idea of the Dixon method is straightforward: two separate sets of images—that is, water-only and fat-only images—can be calculated by intuitive postprocessing of the IP and OP image datasets. The IP and OP image datasets are summed to obtain water-only images, while the OP image dataset is subtracted from the IP image dataset to obtain fat-only images (Fig. 7).
In the early days, Dixon’s original proposal (referred to as the two-point method) was not very successful due to the B0 inhomogeneity that resulted in phase errors and water-fat swapping [10]. Nowadays, however, it became one of the fat-suppression techniques supported by almost all MRI system manufacturers due to the advances in magnet design, the development of shimming techniques, and the evolution of correction and calculation algorithms.
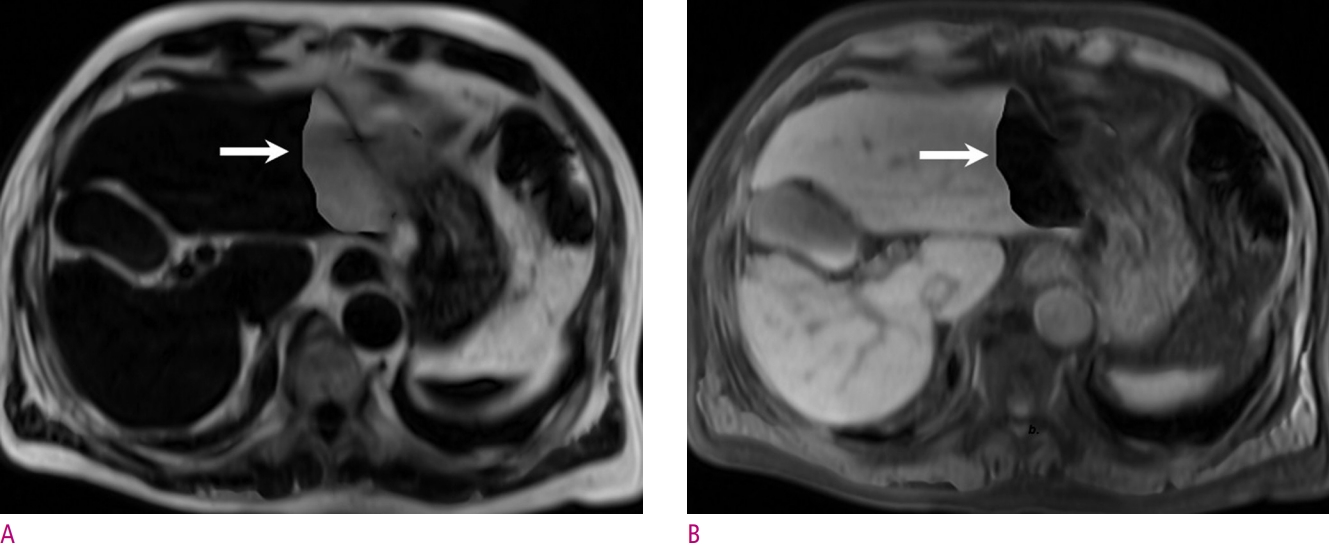
TP [The modern modified Dixon method mainly employs a multipoint (three points or more) approach in which a third imaging phase is added to correct the phase error from the first two images. It is insensitive to both B0 and B1 magnetic field inhomogeneities.] Besides, the various types of modified Dixon methods that currently exist all deliver four image sets with different degrees of contrast during a single acquisition, between the IP and OP images, and between fat-only and water-only images (Fig. 8). This helps with image co-registration and simplification of imaging protocols [7]. As will be explained below, fat-only images can also be used for fat quantification. They can also be used in combination with almost any pulse sequences, including SE, GRE, and contrast-enhanced imaging. Many of these advantages make the modern modified Dixon method the most widely used fat-suppression technique in abdominal MRI. Although generally better than CHESS, the modern Dixon method also suffers from main magnetic field inhomogeneities around metal, which cause very strong susceptibility effects. Further, it also increases the overall scan time, but a few complementary methods have been suggested using optimized parallel imaging algorithms [12]. CME 4a [Interestingly, the Dixon method has a signal swap artifact, which is a unique artifact that cannot be seen in other techniques (Fig. 9). It is a phenomenon in which the signals of water and fat are interchanged due to incorrect convergence in the process of mathematical computations caused by a natural ambiguity between fat and water when only one chemical species dominates the signal from the pixels [10].]
Inversion-based and hybrid techniques
STIR
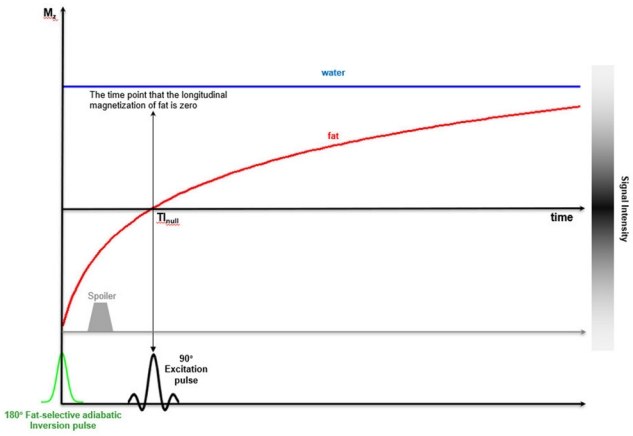
As mentioned earlier, fat protons have a shorter T1 relaxation time than water protons. After a 180° inversion RF pulse, the longitudinal magnetization of fat protons will be restored faster than that of water protons. If a 90° excitation RF pulse is applied at the time point at which the longitudinal magnetization of fat protons is zero (inversion time, TInull), the fat protons will not contribute to the MRI signal, whereas water protons will still produce a signal (Fig. 10). The stronger the main magnetic field, the longer the T1 relaxation time; the TInull value of 3.0-T MRI needed to nullify the fat signal is in the range of 205 to 225 ms as compared with 100 to 200 ms for 1.5-T MR imaging [13].
TP [The STIR method is relatively insensitive to B0 inhomogeneity and can be used with permanent magnets of a low magnetic field strength, which have poor magnetic field homogeneity.] This approach is usually better than other fat-suppression methods (such as CHESS), especially around metallic substances (e.g., orthopedic implants or endoscopic/surgical clips), near tissue interfaces with high susceptibility differences (around a gaseous bowel), and across large body parts (even whole-body imaging). In addition, STIR has another advantage in terms of contrast—specifically, the capacity for additive T1 + T2 contrast. In general SE imaging, T1 and T2 contrast compete with each other. By applying a 180° inversion RF pulse, however, they instead adopt an additive relationship. The image contrast may be increased and, in particular, tissues with long T1 and long T2 relaxation times appear very bright [14].
The first disadvantage of STIR is that the overall signal-to-noise ratio (SNR) of the images is low. When the imaging sequence starts at TInull, most of the protons exhibit a reduced magnitude of longitudinal magnetization and, therefore, the magnitude of transverse magnetization induced by a 90° RF pulse is also reduced, which leads to a reduction in the overall SNR. CME 7b [Another serious drawback of STIR is that fat suppression is nonspecific. Signals from all tissues or substances with a T1 relaxation time similar to fat can be suppressed. These include mucus, hemorrhage, proteinaceous solutions, and even gadolinium for contrast enhancement [15]. Hence, STIR cannot be used as a fat-suppression technique in images after contrast enhancement.] It is also difficult to find the optimal TInull that varies depending on the anatomical location and individual. In terms of the image acquisition time and patient safety, additional inversion pulses significantly increase the total scan time and tissue heating.
SPAIR
SPAIR is a hybrid technique that combines features of both STIR (inversion recovery nulling) and CHESS (fat-selective RF pulse with spoiler gradient) for fat suppression. The technique begins with a 180° inversion fat-selective RF pulse (Fig. 11). Only fat protons are selectively inverted and water protons are not affected. This specially designed RF pulse is called an adiabatic pulse, meaning that both frequency and amplitude are modulated [16]. CME 5d [The advantage of an adiabatic pulse is that it can accurately convert the longitudinal and transverse magnetization by exactly 180°, even if the B1 field is not uniform.] Next, spoiler gradients are employed to ensure the destruction of any inadvertent transverse magnetization of fat protons created by the RF pulse. The subsequent steps are the same as those seen during usual inversion recovery techniques. An excitation RF pulse is applied at the time at which fat protons cross the null point of longitudinal magnetization; these fat protons will not contribute to the MRI signal.
Theoretically, SPAIR may be a very suitable technique for equipment of 3.0 T or higher because it can adopt both the advantages of a high main magnetic field strength that improve the spectral resolution of the chemical shift and the temporal resolution of the inversion recovery [7]. SPAIR is not only relatively less sensitive to B0 inhomogeneity like STIR but also insensitive to B1 inhomogeneity and capable of selective fat supression by using an adiabatic pulse and spoiler gradient [17]. However, there are penalties that occur on the image acquisition time and tissue heating relative to CHESS due to the use of 180° inversion RF pulse and, so, this approach is mainly preferred for T2-weighted imaging.
MRI techniques that quantify fat measurement
Fat signal fraction and proton-density fat fraction (PDFF)
The fat signal fraction is commonly used as an intuitive and simple metric for MRI-based fat-quantification techniques. It can be calculated by dividing the signal from the fat protons by the sum of the signal from the water protons and that from the fat protons. Most recent studies use PDFF as a metric, which can be considered as a standardized, accurate, objective, and reproducible biomarker. It was initially defined by Reeder et al. as the following: “the fraction of unconfounded proton signal from mobile fat, normalized by the total hydrogen proton density from all mobile proton species” [2]. PDFF has been proposed for the quantification of hepatic steatosis, but researchers are now expanding its application to fat quantification of the pancreas, adrenal glands, and fat-containing tumors [18]. To accurately estimate PDFF, all multiple confounding factors described below must be corrected, and this applies to both magnetic resonance spectroscopy (MRS) and MRI-based fat-quantification techniques.
Fat quantification by MRS
MRS represents the type and content of molecules constituting a specific anatomical location (typically a single voxel) as a peak signal. The position of each peak listed on the horizontal axis of the MRS record represents the molecular species, while the size of each peak represents the quantity of the molecular species. Fat and water can be quantified directly from the areas under their corresponding peaks in the acquired spectrum, and the fat fraction can be subsequently calculated [18]. If performed properly, this approach is the most accurate of the noninvasive fat-quantification methods known so far and can detect even very small amounts of fat [2]. MRS has been used as a reference standard to verify accuracy in several MRI-based fat quantification studies [19-22]. Unfortunately, MRS has a fatal drawback: the spatial coverage is extremely limited to only a single voxel and, as a consequence, some degree of sampling error is unavoidable. In addition, there are problems that a lot of time and specialized experts are required to perform MRS and analyze the results.
Chemical shift-based method for fat quantification
CME 6b [Several researchers have proposed fat-quantification techniques using chemical shift-based methods, especially based on the two- or multipoint Dixon method [21].] These chemical shift-based methods are classified into two categories as follows, depending on their use of phase data: magnitude-based and complex-based. In contrast, the magnitude-based method discards phase data, while the complex-based method uses it.
In the most widely used simple magnitude-based two-point Dixon method, the fat signal fraction can be obtained by dividing the difference between the IP and OP signal intensities by double the IP signal intensity (Fig. 7). Recall that IP is the sum of the signals from water and fat protons, and OP is the difference between the signals of water and fat protons. However, the fat signal fraction acquired by the calculation presented above does not reflect the true fat fraction (i.e. PDFF) because of multiple confounding factors (e.g., T1-weighting bias, T2* decay, spectral complexity of the fat, noise bias, and eddy currents) that corrupt the ability of the technique to quantify fat [22]. PDFF can be accurately measured only by removing the effects of these multiple confounding factors. It is also important to note that using a magnitude-based approach is only possible to achieve a dynamic range of 0% to 50% of the fat signal fraction [2]. This limitation can only be resolved with additional phase information [23], so the complex-based method is necessary to quantify tissues composed mostly of fat, such as adipose tissue.
T1-weighting bias as a confounding factor
Most MRI methods used to acquire fat fraction images use T1-weighted GRE methods. In this context, T1-weighting bias occurs because these T1-weighted sequences artificially amplify the relative signal of the shorter T1 proton species, which will result in a measured fat fraction that is greater than the true fat fraction (i.e., overestimation). The use of low-flip-angle GRE imaging to avoid T1-weighting is the strategy generally adopted by most emerging approaches that attempt to avoid the T1-weighting bias [24].
T2* decay as a confounding factor
MRI methods used to quantify fat employ multiple different echo times from one another. Regardless, however, during that time, T2* decay is ongoing and corrupts estimates of the fat fraction. This process is especially amplified in iron-overload conditions (which produce T2* shortening), and the measured fat fraction can be markedly underestimated. The confounding effect of T2* can be removed by either incorporating T2* into the signal model used to separate water and fat, thereby correcting for T2* decay as part of the fitting [27, 28], or by measuring T2* separately and correcting for the effects of T2* [29, 30].
Spectral complexity of fat as a confounding factor
Usual chemical shift-based fat quantification methods assume the signal from fat exists as a single spectral peak at ~3.5 ppm upfield from that of water. Unfortunately, this assumption is not true. At clinical magnetic field strengths, fat protons have at least six distinct spectral peaks at different resonance frequencies. This will lead to significant quantification errors [29]. A method called “spectral modeling” was proposed to correct the error due to the additional peaks of the fat. It is based on the biochemical structure of human liver triglycerides and has been devised independently by several researchers [27, 32] based on an algorithm for chemical shift species separation for hyperpolarized 13C imaging [31].
Noise bias as a confounding factor
Noise bias occurs if the magnitude of water and fat images have low signal intensities (i.e., values near 0). In these areas, most of the acquired signals contain almost only the magnitude of noise. Consqeuncely, the signal intensities of the decomposed fat images with low fat content and water images with low water content will be artifactually increased by the noise. Phase-constrained reconstruction or magnitude-discrimination methods can be ways to eliminate noise bias [24]. For images with high SNR, the former is preferred, while, in the opposite case, the latter method is preferred.
Eddy currents as a confounding factor
Rapidly switching gradients make loops of electrical current, known as eddy currents, which lead to phase shift in complex images acquired at different echo times. Eventually, these currents induce errors in the fat fraction estimation of techniques using phase information. There are two main ways to correct these eddy currents. The first is to use magnitude-based techniques [34, 35], which do not use any phase information and are naturally immune to eddy currents, but, as mentioned above, their dynamic range is limited to 0% to 50%. As such, a hybrid complex-magnitude approach using magnitude fitting has also been proposed to correct the eddy currents while maintaining the full dynamic range [34].
Complex-based technique with confounding factor correction
CME 6b [The iterative decomposition of water and fat with echo asymmetry and least-squares estimation (IDEAL) is an algorithm based on GRE imaging and the multipoint Dixon method [35].] IDEAL begins by gaining multi-echo (at least three) magnitude and phase image pairs. Collected multi-echo signals can be formulated in a matrix form as follows:
where S denotes the acquired signals, the matrix A is considered known, and n is the variance of noise [36]. Water and fat components can be calculated from a weighted least-squares inversion as follows:
where the weights are given by W. This equation can be solved using a modified Gauss-Newton algorithm iteratively [37]. Finally, by adding algorithms (e.g., low flip angle, T2* correction, spectral modeling of fat, magnitude discrimination, and magnitude fitting) that correct the multiple confounding factors shown above, it is possible to accurately calculate PDFF while having a full dynamic range (Fig. 12).
Conclusion
The detection and quantification of fat in abdominal MRI is an important part of diagnosis and research. Recent fat-suppression techniques can be divided into chemical shift-based and inversion-recovery techniques, and are continuously developing rapidly. Each technique has its own strengths and limitations. TP [The most recent proposed fat-quantification techniques are based on the modern modified Dixon method and algorithms for correcting multiple confounding factors have been added to it. These techniques can accurately and noninvasively measure PDFF.] For radiologists, good understanding and proper application of these techniques are undoubtedly important and helpful in identifying and analyzing abdominal pathologic conditions such as tumor or chronic parenchymal disease.


 PDF Links
 PubReader
 ePub Link
 Full text via DOI
 Download Citation
 Print
Print