Korean J Abdom Radiol > Volume 7(1); 2023 > Article
원발성 간암에서 라디오믹스의 이용

Abstract

Radiomics refers to a method for extracting quantitative features from images and analyzing them. Compared with classic visual image analysis, radiomics provides a more comprehensive and objective approach and is expected to provide additional information from images that cannot be achieved with visual image analysis. Radiomics has been investigated for its potential in predicting the prognosis and biologic behavior of primary liver cancers. Although radiomics offers some advantages, it has several limitations that need to be addressed before it can be used in clinical practice. In this review article, I will discuss radiomics features, the typical processes for radiomics analysis, representative research on radiomics applications in liver cancers, and the limitations of radiomics.

초록

라디오믹스는 영상에서 정량적 영상 지표를 추출하고 이를 이용하여 영상을 분석하는 일련의 방법을 의미한다. 라디오믹스는 고식적인 영상분석과 달리 영상 소견을 정량적, 객관적, 종합적으로 분석할 수 있는 방법으로, 기존의 영상분석이 제공하지 못하는 추가적인 정보를 제공할 수 있는 방법으로 기대를 모으고 있다. 원발성 간암 영역에서 라디오믹스는 주로 종양의 예후와 생물학적 특성을 예측하는 분야에 활용되고 있다. 라디오믹스는 그 잠재적 가능성과 장점에도 불구하고 실제 임상 현장에 적용되기 위해서는 여러가지 한계점을 극복해야 할 것으로 보인다. 본 종설은 라디오믹스 지표와 분석 방법을 설명하고, 원발성 간암의 평가를 위해 라디오믹스가 이용된 대표적인 연구들을 요약하고, 라디오믹스가 극복해야 할 문제점에 대해서 논의하고자 한다.

서 론

라디오믹스 (Radiomics, 의료영상정보체학)는 영상에서 여러가지 정량적 영상 지표 (image-derived features)을 추출하고 이를 이용하여 영상을 분석하는 일련의 방법을 의미한다. 고식적인 영상 분석이 영상 소견을 정성적 주관적으로 분석한다면, 라디오믹스는 영상 표현 유형 (phenotype)을 정량적 객관적 종합적으로 분석한다. 라디오믹스는 질병 진행에 따른 병리학적 변화 및 종양의 미세환경의 변화에 따라 영상에 나타난 형태와 질감을 종합적으로 분석할 수 있다. 라디오믹스는 환자맞춤의학 (personalized medicine)의 일환으로 악성 종양의 특성 을 분석하는 방법으로 각광받고 있는데, 그 근본 가설은 질병의 표현유형은 질병의 유전적 변형, 병태 생리학, 병리적 변화를 반영하여, 따라서 라디오믹스를 이용한 영상 표현 유형의 분석은 질병의 생물학적 특성을 반영할 수 있다는 것이다[1, 2]. 라디오믹스는 고식적 영상 분석이 제공하지 못하는 추가적인 정보를 제공할 수 있을 것이라는 기대에 힘입어 원발성 간암의 평가를 비롯한 영상의학의 여러 분야에 연구가 진행되고 있다.

라디오믹스 지표

라디오믹스 지표의 표준화를 위해 북미영상의학회 산하의 정량적 영상 바이오마커 연구회 (Quantitative image biomarker alliance, QIBA)에서 발간한 매뉴얼에는 형태학적, 히스토그램, 텍스처 지표를 포함한 총 172개의 라디오믹스 지표가 정의되어 있다[3]. 여기에 영상에 필터를 적용해 변형한 후 텍스처 지표를 추출하는 고차원 지표를 추가하면 매뉴얼에 정의된 지표의 수배 - 수십배의 라디오믹스 지표를 추출할 수 있다.

형태학적 지표

라디오믹스 지표 추출의 대상이 되는 관심 영역 (regions of interest, ROI)의 모양을 기술하는 지표이다. ROI의 모양이 원형에 가까운 정도, 매끈하거나 울퉁불퉁한 정도, 길쭉한 정도 등을 수학적 정량적 지표로 표현한 것이다[2, 3].

히스토그램 지표

ROI내에 있는 픽셀 값의 전체적 분포를 기술하는 지표이다. 즉 픽셀 값의 밝기가 어느 정도인지 (평균), 그 분포가 특정 값에 밀집되어 있는지 널게 분포하는지 (표준편차와 변이계수), 한쪽으로 치우쳐져 있는지 (skewness), 히스토그램의 첨도 (kurtosis), 히스토그램 분포의 무작위성 (randomness), 균일도 (energy, uniformity) 등을 표현하는 지표로 구성된다[2, 3].

텍스처 지표

라디오믹스 분석에 가장 중요하고, 많은 수의 지표를 파생시킬 수 있는 지표이다. 히스토그램 지표가 ROI내 픽셀 값의 전체적인 분포를 설명하는데 반하여 텍스처 지표는 ROI내에 있는 픽셀 간의 공간적 관계 즉 질감 패턴을 분석하는 지표이다. 텍스처 지표의 추출을 위해서는 영상에서 여러 종류의 매트릭스를 먼저 만든 후에 각 매트릭스에서 지표를 계산한다. QIBA의 매뉴얼에 기술한 매트릭스는 grey level co-occurrence matrix (GLCM), grey level run length matrix (GLRLM), grey level size zone matrix (GLSZM), grey level distance zone matrix (GLDZM), neighborhood grey tone difference matrix (NGTDM), neighboring grey level dependence matrix (NGLDM) 등의 6가지가 있고, 각 매트릭스에서 5-25가지의 지표를 산출할 수 있다. 가장 흔히 사용되는 GLCM은 인접한 2개의 픽셀이 특정 픽셀 값을 가지는 경우의 빈도를 기록한 매트릭스이고, GLRML은 특정 픽셀 값을 가진 픽셀이 연속되어 나타나는 길이의 빈도를 기록한 매트릭스이다 (Fig. 1). 이렇게 만들어진 매트릭스를 이용하여 특정 패턴을 강조하는 텍스처 지표를 계산하게 된다. 예를 들어 GLRML 매트릭스의 지표 중 LRLGE (long run low grey level emphasis)와 LRHGE (long run high grey level emphasis)는 각각 낮은 값을 가지는 픽셀이 길게 늘어선 경우와 높은 값을 가지 픽셀이 길게 늘어선 패턴을 강조하는 지표이다. 텍스처 매트릭스는 방향성이 있으므로 보통 네 방향 (0°, 45°, 90°, 135°)으로 계산 후 평균하여 매트릭스를 얻는다[2, 3].

고차원 지표

고차원 지표는 영상에 필터를 이용하여 변형한 후에 추출한 텍스처 지표를 의미한다. 흔히 사용되는 필터는 영상의 노이즈를 줄이면서 흐릿하게 만드는 Gaussian filter, 영상의 경계면을 강조하는 Laplacian filter, 두가지를 합하여 경계를 강조하면서 노이즈는 억제하는 Laplacian of Gaussian filter 등이 있다. Wavelet filter는 영상의 고 주파수 영역 (high frequency)과 저 주파수 영역 (low frequency)을 분리할 수 있는 필터이다[2, 3]. 영상에서 얻어지는 고차원 지표의 수는 영상 변형에 사용한 필터 수를 텍스처 지표의 수로 곱한 값이다. 즉 여러 개의 영상 필터를 사용하면 매우 많은 고차원 지표를 얻을 수가 있으므로, 전체 라디오믹스 지표의 수는 고차원 지표를 얼마나 얻는지에 따라 결정된다고 볼 수 있다. 많은 수의 라디오믹스 지표를 얻어서 수행한 라디오믹스 연구가 꼭 훌륭한 연구를 의미하는 것은 아니다. 오히려 여러 개의 높은 연관성을 가진 비슷한 지표들을 필요 이상으로 많이 얻어서 지표 선정이 어려워질 수도 있다.

딥러닝 라디오믹스 지표

딥러닝에 사용되는 합성곱 신경망 (convolutional neural networks, CNN)은 convolution과 pooling 과정을 거치면서 영상 지표를 추출한 후 완전 연결층 (fully connected layer)을 거치면서 지표를 종합하여 결론을 도출한다. 일부 연구자들은 CNN을 지표 추출에 이용하기도 한다. 즉 CNN을 이용하여 지표를 추출한 후 완전 연결층에서 지표를 분석하는 대신 라디오믹스 분석 방식에 따라 지표 선정 모델링 과정을 통해 라디오믹스 모델을 만들기도 한다[4].

라디오믹스 분석 절차

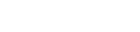
라디오믹스 분석은 영상 전처리, 분할, 라디오믹스 지표추출, 지표선정과 모델링, 개발된 모델의 검증 과정을 거친다 (Fig. 2).

영상 전처리 (image pre-processing)

라디오믹스 지표는 영상 픽셀의 크기에 따라 다른 값이 추출될 수 있으므로 라디오믹스 분석을 위해 영상 픽셀의 크기를 일정하게 통일하는 interpolation 과정이 필요하다. 또한 영상 픽셀 값의 표준화 과정도 필요하다. 특히 영상 픽셀 값이 임의적인 신호강도 값으로 정해지는 MRI의 경우 ROI내 픽셀의 신호 강도를 특정 장기의 신호강도로 나누어서 정규화 (normalization)하기도 한다. ROI 내에 예외적으로 높거나 낮은 값의 영향을 줄이기 위해 평균과 표준편차를 이용하여 픽셀 신호강도의 상한과 하한을 정하기도 한다. CT나 MRI 영상은 넓은 픽셀 값 범위 (dynamic range)를 가진다. 라디오믹스 지표를 추출하는데 이런 넓은 픽셀 값 범위를 그대로 사용하면, 영상 잡음에 의한 값 차이까지 라디오믹스 지표에 반영될 수 있고, 라디오믹스 지표 산출에 필요한 시간과 계산 용량이 커지는 단점이 있다. 따라서 라디오믹스 지표의 추출 전에 픽셀 밝기 단계 (bin)를 몇 단계로 처리할지 정하는 과정 (intensity discretization)이 필요하다 (Fig. 3).

분할 (segmentation)

전체 영상에서 라디오믹스 지표를 추출할 ROI를 정의하는 과정을 의미한다. 수작업 혹은 반자동 소프트웨어를 이용하여 ROI를 영상에 그리게 되는데, 시간과 노력이 많이 소요되는 작업이다. 종양의 ROI를 그릴 때는 종양의 외연을 따라서 ROI를 그리는 경우가 많지만, 간세포암 (hepatocellular carcinoma)의 예후를 예측하는 경우 주변 간조직의 상태, 즉 간경화 여부 등이 간세포암의 재발에 영향을 주기 때문에 종양 주변 조직까지 ROI에 포함하는 것이 유리할 수 있다[5, 6].

라디오믹스 지표 추출 (feature extraction)

ROI를 설정한 후 ROI내에서 라디오믹스 지표를 추출한다. 라디오믹스 지표는 2차원 혹은 3차원으로 추출할 수 있는데, 3차원 특성인자 추출을 위해서는 영상의 픽셀이 등척성 (isometric)이어야 한다. 추출하고자 하는 지표의 수와 종류, ROI의 크기, bin 수, 컴퓨터의 계산 성능 등에 따라 지표 추출에 필요한 시간이 달라지고 수분에서 수십분까지 시간이 소요될 수 있다.

라디오믹스 지표 선정 (feature selection)과 모델링 (modeling)

라디오믹스 분석은 일반적으로 많은 수의 지표를 산출하여 수행된다. 하지만 최종 진단 혹은 예측 모델에 많은 수의 지표가 포함되면 과적합 (overfitting) 문제가 발생한다. 즉 모델이 많은 변수를 이용하여 학습 데이터를 설명하도록 훈련되면, 데이터 내의 노이즈까지 반영하게 된다. 이 경우 학습 데이터에서는 모델의 성능이 우수하지만, 다른 데이터가 주어지는 경우 모델의 성능이 크게 저하될 수 있다. 또한 라디오믹스 지표들은 지표 간의 연관성이 높아[7], 꼭 필요한 지표만을 선정하는 작업이 최종 모델링 이전에 필요하다. 지표 선정 과정은 지표의 재현성, 모델링 대상이 되는 결과와의 연관 정도, 지표 간의 관련성 등을 평가하여 단계적으로 선정하기도 하고, 알고리즘에 의한 자동 지표 선정을 이용하기도 한다. 우리가 임상연구에서 일반적으로 이용하는 회귀분석 기법은 라디오믹스처럼 매우 많은 수의 다중공선성 (multicollinearity)이 있는 지표의 처리에는 부적합하다. 따라서 지표 선정 및 모델링 과정에는 기계학습이나 벌점 회귀분석 (penalized regression) 등의 방법이 흔히 이용된다.

라디오믹스 모델의 검증

과적합 등의 다변수 모델의 문제점을 최소화 하기위해 전술한 지표 선정 및 모델링 과정을 거쳤다 하더라도 이런 문제점이 여전히 남아 있을 수 있고, 라디오믹스 지표는 영상기법 및 영상 기기에 영향을 받을 수 있으므로 개발된 라디오믹스 모델의 일반화 가능성을 증명하기 위해서는 외부 검증이 필요하다. 특히 라디오믹스 지표는 다른 영상기기 간에 재현성이 낮은 경향이 있으므로[8], 다양한 영상 기기를 이용한 다기관 자료를 이용한 한 외부검증이 선호된다. 라디오믹스 모델의 검증에는 다변수 진단/예측 모델의 검증에 사용되는 통계적 방법이 이용된다. 모델의 식별능 (discrimination performance)은 생존 예측 모델의 경우 Harrell’s C-index가, 진단 모델의 경우 ROC 곡선하 영역이 흔히 이용된다. 모델의 계측능 (calibration performance)는 모델로 예측된 사건 발생 가능성과 실제 자료의 사건 발생율을 그래프로 표시한 calibration plot이 흔히 이용된다[9].

원발성 간암에 라디오믹스 적용

원발성 간암은 간세포암 (hepatecellular carcinoma), 간내담관암 (intrahepatic cholangiocarcinoma), 혼합간세포담관암 (combined hepatocellular cholangiocarcinoma)이 대부분을 차지한다. 간세포암, 간내담관암, 혼합간세포담관암은 각각 특징적인 임상적 영상의학적 소견과 병리학적 소견을 가지지만, 그 소견이 중첩되어 구분이 어려운 경우도 있다. 또한 간세포암, 간내담관암, 혼합간세포담관암 안에서도 상당한 이질성이 관찰되며, 이를 반영하여 최근의 WHO 분류에서는 간세포암에 예후가 불량한 거대소주 괴상형 (macrotrabecular massive, MTM) 및 경성형 (schirrhous)을 포함한 8가지 아형을 정의하고 있다. 간내담관암은 대담관형 (large duct type)과 소담관형 (small duct type)으로 구분한다. 혼합간세포담관암은 종양을 구성하는 세포에 따른 명명법이 제안된 상태이다.
이러한 종양 이질성 때문에 동일한 진단의 간암이라도 다양한 예후를 보일 수 있다. 종양의 영상 표현형은 종양의 병리적 특성과 구조를 반영한다는 가설 하에 종양의 표현형의 분석을 통해 종양의 예후와 생물학적 특성을 예측하고자 하는 연구가 진행된 바 있다. 최 등은 LI-RADS (Liver imaging reporting and data system) 분류가 간암의 병리적 진단과 별도로 예후를 반영한다고 보고하였는데, 간세포암과 혼합간세포담관암의 경우 LR-M으로 분류된 종양은 LR-4 혹은 LR-5로 분류된 종양에 비해 불량한 예후를 보였다[10]. 그 외에 간세포암 중 예후가 불량한 CK-19 양성 형, TP-53 변이 형, MTM형의 영상 소견이 보고된 바 있고, 또한 염색체 불안정성과 다양한 유전적 변이가 동반된 증식형 (proliferative) 간세포암의 영상 특성도 보고되었다[11-14]. 간세포암의 수술 및 국소 치료 후 나쁜 예후와 연관된 미세혈관침습 (microvascular invasion)을 예측하는 영상 소견들 (매끈하지 않은 종양 경계, 동맥기 종양 주변 조영증강, 간담도기 종양주변 저신호강도)도 보고되었다[15]. 이러한 정성적 영상 소견을 바탕으로 한 종양의 예후 예측은 판독자의 주관에 영향을 받을 수 있고, 개별 소견의 유무를 객관적으로 판단하기 어려운 경우도 있다. 이에 반하여 라디오믹스는 영상에서 다수의 정량적 지표를 추출하여 분석하므로 고식적 영상 판독에 비해서 객관적인 분석이 가능하고, 다양한 지표를 포괄적으로 분석할 수 있다는 잠재적인 장점이 있다. 또한 라디오믹스 분석을 통해 고식적인 영상분석에서 얻기 힘든 추가적인 정보를 얻을 수 있다는 기대도 있다. 이러한 배경하에 최근 수년간 라디오믹스를 이용하여 간암을 평가하고자 하는 다양한 시도가 있었다. 간암의 평가에 있어서 라디오믹스의 이용은 주로 종양의 치료 후 예후를 예측하거나 불량한 예후인자를 발견하는 연구가 주를 이룬다. 종양의 특정 아형을 진단하거나 감별진단을 위한 라디오믹스 모델도 보고된 바 있으나, 라디오믹스 분석이 시간과 노력이 많이 소요되는 분석법임을 고려할 때 이러한 좁은 적용분야의 모델은 임상적 유용성이 낮다고 생각된다.

간세포암

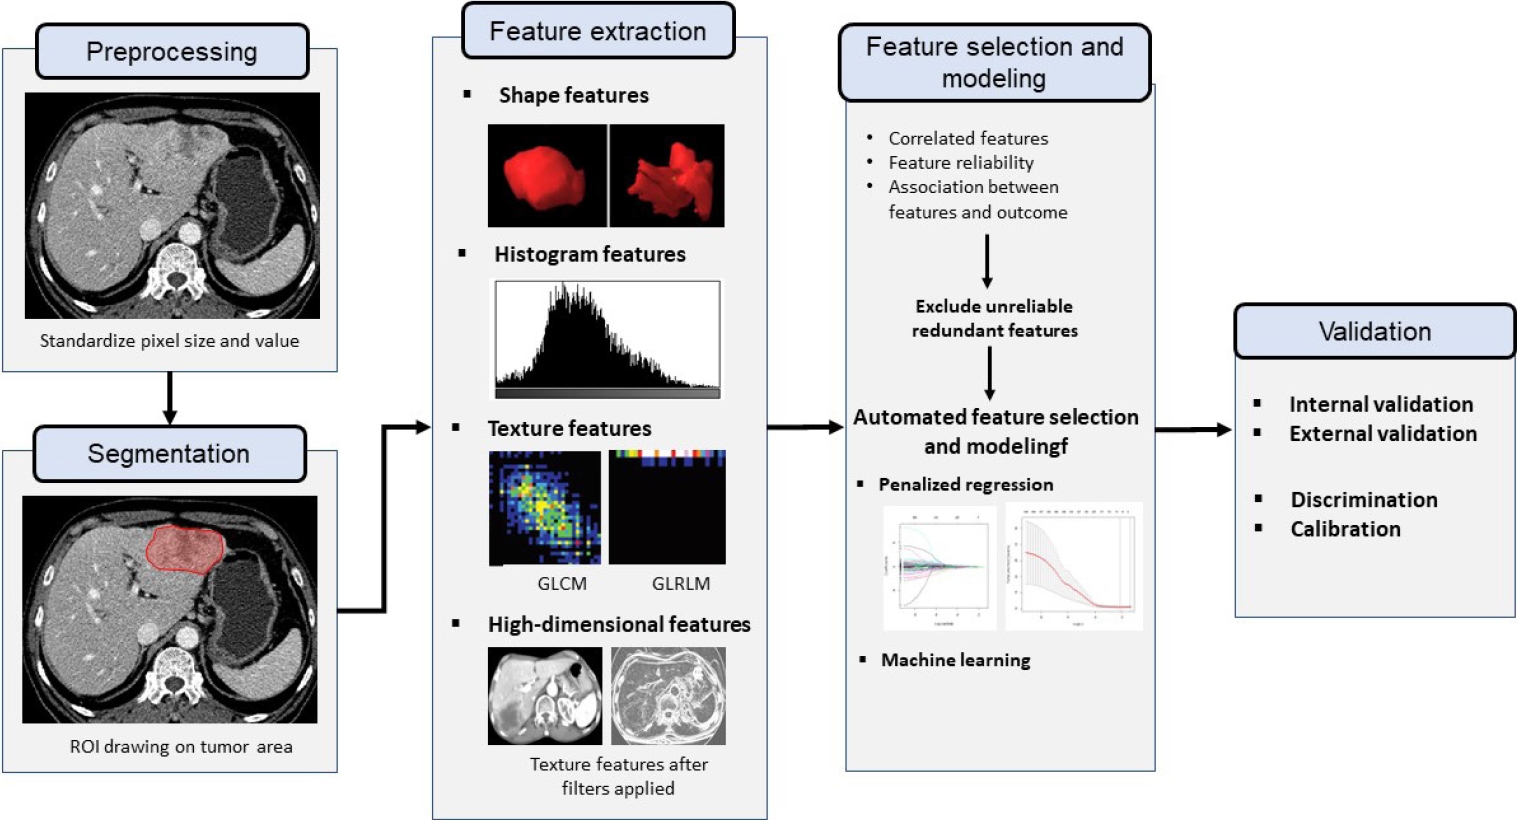
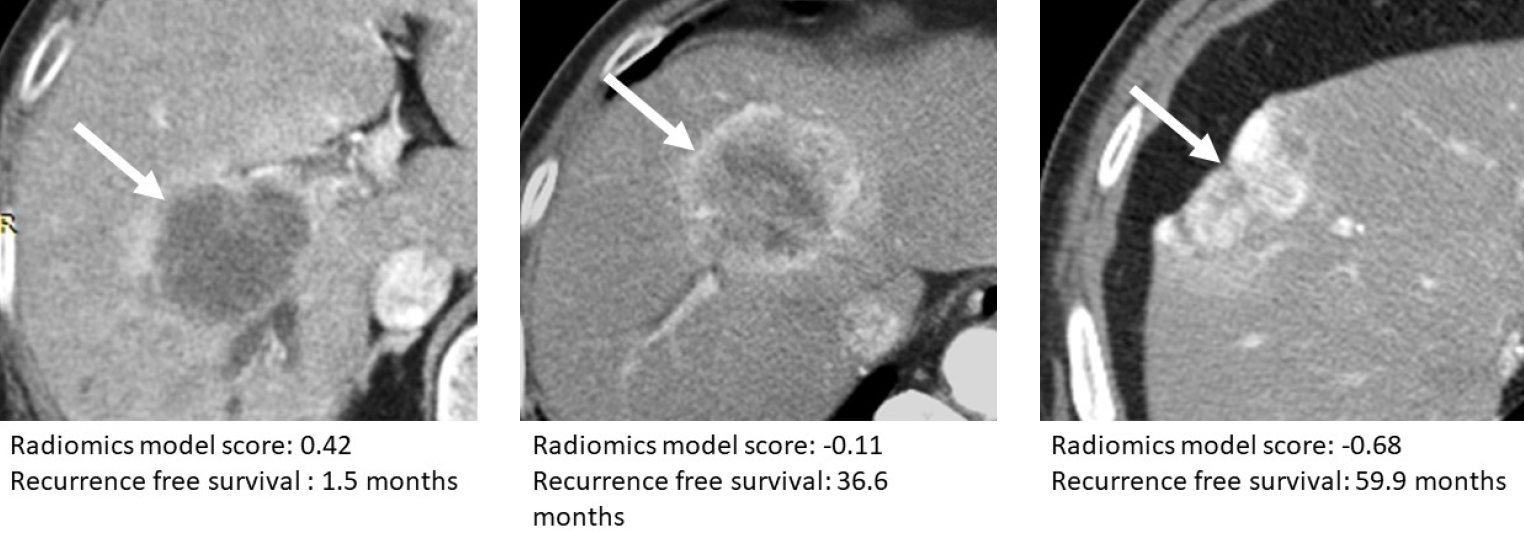
Table 1에는 간세포암에 대한 대표적인 라디오믹스 연구들이 요약되어 있다. 여러 연구에서 라디오믹스를 이용하여 간세포암의 미세혈관침범 여부를 진단[16, 17], 수술 혹은 고주파 열 치료 후 재발을 예측[4, 5, 18, 19[, 혹은 나쁜 예후와 연관된 야형은 진단하는[6, 20] 라디오믹스 모델을 보고하였다. 표 1에서 각 연구에서 개발한 모델의 식별 성능 (discrimination performance)이 concordance index (C-index)를 이용하여 요약되어 있다. C-index는 모델을 이용하여 평가된 위험 점수가 높은 사람이 실제로 높은 위험을 가질 확률의 의미를 가지는 지표이다[21]. 이분법적 (binary) 판단의 경우 C-index는 ROC 곡선하 면적과 동일한 의미이고, 생존자료 분석의 경우 Harrel’s C-index 값을 의미한다. C-index 값이 1에 가까울 수록 모델의 진단 혹은 예측능이 완벽에 가깝다는 의미이고, C-index 0.5는 모델의 진단 예측능이 무작위 선택의 수준임을 의미한다.
김 등은 gadoxetic acid를 이용한 MRI를 이용하여 수술 후 재발 예측 모델을 개발하였는데, 흥미로운 것은 종양만을 ROI에 포함한 경우보다 종양 주변의 3-mm 혹은 5-mm 영역을 ROI에 포함한 모델이 높은 예측능을 보였다. 종양 주변의 동맥기 조영 증강 및 간담도기 저신호 강도가 미세혈관 침범과 연관되는 소견임을 고려할 때[15], 이러한 종양 주변 변화가 라디오믹스에 반영되어 모델의 예측능을 개선한 것으로 추측된다. Liu 등은 고주파 열 치료 혹은 수술적 치료를 받은 5 cm 이하의 단발성 HCC 환자에서 조영증강 초음파 영상을 이용하여 각각의 치료 후 재발을 예측하는 모델을 발표하였다[4]. 이 연구에 서는 딥러닝 알고리즘을 이용하여 라디오믹스 지표를 추출하였고, 지표 선택과 모델링은 라디오믹스 방식을 이용했다는 점을 주목할 만하다. 또한 수술 혹은 고주파 열 치료가 모두 가능한 환자군에서 어떤 치료를 받는 것이 유리할 지 판단하는데 도움이 될 수 있다는 점에서 임상 활용도가 우수한 연구로 생각된다. 이 연구에서는 환자군을 두가지 모델로 분석하였을 때 고주파 열치료를 받은 환자의 17.3%와 수술 환자의 27.3%가 다른 치료를 받았을 경우 재발 위험도가 낮게 예측되었다고 보고하였다[4]. 최근에는 macrotrabecular massive 아형이나 vessels encapsulating tumor clusters 소견 등 간세포암의 불량한 예후와 관련된 병리 소견을 예측하는 라디오믹스 모델이 발표되었다[6, 20].

간내담관암과 혼합간세포담관암

Table 2에는 간내담관암 및 혼합간세포담관암에 대한 대표적인 라디오믹스 연구들이 요약되어 있다. 간세포암에 비해서 다른 간암에 대한 라디오믹스 연구는 상대적으로 연구의 규모와 연구 수가 적은 편이다. 박 등은 국내 다기관 데이터를 기반으로 CT를 이용한 라디오믹스로 간내담관암의 수술 후 재발을 예측하는 연구를 수행하였다. 라디오믹스 모델 및 예후 예측에 중요한 고식적 영상소견 (침습형, 다발성, 단관 침범, 주변장기 침범, 림프절전이 의심)을 라디오믹스 모델에 추가한 통합 라디오믹스-영상 모델을 개발하였다[22]. 개발된 통합 모델은 Harrel’s C-index 0.71의 비교적 우수한 예측능을 보였다 (Fig. 4). 또한 Song 등도 수술 후 1년이내 조기 재발을 예측하는 라디오믹스-영상 모델을 개발하였고, 이 모델은 수술 후 AJCC 8판에 따른 병기보다 높은 예측능을 보였다[23]. 그외 담관암의 불량한 예후 인자로 알려진 림프절 전이를 예측[24], 간내담관암의 미세혈관 침범을 예측하는 모델[25] 등이 개발되었고, C-index 0.8~0.85 정도의 비교적 우수하 예측능을 보였다.

라디오믹스의 한계점

라디오믹스 모델은 정량적 영상 지표를 이용하여 병변의 표현형을 객관적 종합적으로 분석하여 고식적인 영상분석에서 얻기 힘든 추가적인 정보를 제공할 수 있는 유망한 영상 분석법으로 관심을 모으고 있다. 하지만 라디오믹스 기반의 진단/예측 모델은 임상 현장에 적용되기 전에 개선되어야 할 여러가지 한계점을 가진다.
라디오믹스 지표는 지표 추출을 위한 조건에 따라서 다른 결과가 나올 수 있다. 따라서 라디오믹스 연구 결과를 발표할 때는 다른 연구자가 재현할 수 있도록 라디오믹스 지표 추출 조건, 즉 영상 픽셀 크기 처리, 픽셀 값의 정규화 방법, 지표 추출을 위한 픽셀 밝기 단계 (bin) 정의 등에 대한 기술이 있어야만 한다. 이런 배경에서 QIBA는 라디오믹스 지표의 정의, 분석 방법, 결과 보고 등에 대한 컨센서스 가이드라인을 출간하였다[3]. 그럼에도 불구하고 여전히 라디오믹스 연구 논문에는 이런 기술적 부분에 대한 설명이 부족한 경우가 많다.
라디오믹스 모델은 재현성 및 일반화에 제한점이 있다. 라디오믹스 지표는 영상 기기, 영상 기법, 영상 재구성 방식에 영향을 받는다. 따라서 라디오믹스 지표 및 이에 기반한 진단/예측 모델은 다른 영상 기법을 사용하는 병원들 간에 결과의 재현성이 떨어질 수 있다. 라디오믹스 지표의 기관 간 변이를 줄이기위한 알고리즘이 제안되었으나 그 유용성에 대해서는 추가적인 검증이 필요하다[26]. 또한 라디오믹스 모델은 수많은 지표를 기반으로 만들어지므로 모델의 과적화 문제가 발생할 소지가 있다. 과적화 된 모델은 훈련 데이터에서는 높은 성능을 보이지만 이와 다른 데이터에서는 그렇지 못하다. 따라서 라디오믹스 모델은 일반적인 진단 예측 모델에 비해 더 철저한 검증과정이 필요하며, 여러 기관의 데이터를 이용한 외부검증이 선호된다.
마지막으로 라디오믹스 모델이 임상 현장에 이용하기 힘든 가장 큰 이유 중 하나는 라디오믹스 분석이 많은 시간과 노력이 요구된다는 점이다. 라디오믹스 모델의 적용을 위해서는 영상에 ROI를 그리는 작업, ROI에서 라디오믹스 지표를 추출하는 작업이 필요한데, 모두 상당한 시간과 노동 및 컴퓨터 성능이 요구되는 작업이다. 특히 라디오믹스 모델이 여러 종류의 텍스처 지표 혹은 고차원 지표를 포함하는 경우에는 모델을 이용한 영상 분석을 위해서는 여러 텍스처 매트릭스를 계산하는 작업을 수행해야 하므로 컴퓨터 연산작업에도 긴 시간이 소요될 수 있다.

결 론

라디오믹스는 그 잠재적 가능성 및 장점과 함께 뚜렷한 한계점을 가지는 영상 분석 방법이다. 최근 여러 연구를 통하여 원발성 간암을 분류하고 치료반응을 예측하기 위한 라디오믹스 모델들이 발표되고 있으나, 아직도 대부분 연구 단계에 머물러 있는 수준이다. 라디오믹스 모델의 임상 적용을 위해서는 라디오믹스의 한계점을 개선을 위한 추가 연구가 필요할 것으로 생각된다.

Notes

Funding

이 성과는 정부(과학기술정보통신부)의 재원으로 한국연구재단의 지원을 받아 수행된 연구임 (No. 2020R1F1A1048826).

Fig. 1.

Example of calculating texture features based on GLCM and GLRLM matrices.

Assuming a grayscale image with a 4x4 pixels and three level grayscale bins, each pixel value is represented numerically. GLCM describes the frequency of adjacent pixel pairs exhibiting specific pixel value patterns. GLRLM describes the frequency of patterns where a specific pixel value is continuously repeated for a certain length in an image. The final GLCM and GLRLM matrices are obtained by averaging matrices obtained in four directions (0°, 45°, 90°, 135°). Texture features are then computed from the matrices.
kjar-2023-00031f1.jpg
Fig. 2.

Schematic drawing of radiomics analysis process.

kjar-2023-00031f2.jpg
Fig. 3.

Intensity discretization as the preprocessing stem prior to radiomics feature extraction.

Region-of-interest (ROI) was defined in the tumor located in the left hepatic lobe of the liver on a CT image. The histogram distributions of the pixel values within the ROI were compared between two settings: using 64 bins and using 16 bins for grayscale step size. Image processing using a higher number of bins allows for capturing smaller pixel value differences in the radiomics features at the expense of longer computation time.
kjar-2023-00031f3.jpg
Fig. 4.

Prediction of postoperative recurrence-free survival in patients with intrahepatic mass-forming cholangiocarcinoma using a radiomics model.

Arterial phase CT images of three surgically confirmed cases of intrahepatic cholangiocarcinoma demonstrate tumors (arrows) exhibiting diverse patterns of contrast enhancement. The radiomics model scores and actual recurrence-free survival times are provided below each CT image. A trend is observed, wherein lower radiomics model scores are associated with longer recurrence-free survival times. Tumors with lower radiomics model scores demonstrate a larger area of arterial enhancement compared to those with higher radiomics model score.
kjar-2023-00031f4.jpg
Table 1.
Representative studies on clinical application of radiomics in hepatocellular carcinoma
Reference Task Imaging Patient N Validation (Patient N) Main findings*
Xu et al. 2019 [16] MVI CT 495 Internal (145) C-index for radiomics-imaging model: 0.889
Yang et al. 2019 [17] MVI Gadoxetic acid-MRI 208 Internal (62) Radiomics model based on HBP image and T1 map.
C-index for radiomics-imaging model: 0.861
Kim et al. 2019 [5] Recurrence after surgery Gadoxetic acid-MRI 167 Internal (37) C-index for radiomics-clinical model (including 3-mm peritumoral area): 0.72
Improved performance of radiomics model including peritumoral area
Ji et al. 2019 [18] Recurrence after surgery CT 470 External (107) C-index for preoperative radiomics-clinical model: 0.733
C-index for postoperative radiomics-clinical model: 0.741
Better performance of radiomics-clinical model compared with clinical model or postoperative pathologic tumor stage
Ji et al. 2020 [19] Recurrence after surgery Recurrence after surgery or RFA CT 295 External (118) C-index for preoperative radiomics-clinical: 0.78
C-index for postoperative radiomics-clinical model: 0.82
Liu et al. 2020 [4] VECT CEUS 419 (RFA = 214, surgery = 205) Internal (RFA = 65, surgery = 61) Radiomics feature extraction using CNN
C-index for RFA radiomics-nomogram: 0.727
C-index for surgery radiomic-nomogram: 0.719
Yu et al. 2022 [6] MTM Gadoxetic acid-MRI 182 Internal (54) C-index for radiomics including peritumoral area: 0.972
Better performance of radiomics model including peritumoral area compared with model only including tumor
Predicted VECT+ using radiomics model was an independent predictor for recurrence.
Feng et al. 2023 [20] subtype CT 365 External (108) C-index for radiomics model in detecting MTM subtype: 0.74
Radiomic model predicted PFS in a separate cohort where nonsurgical treatment was performed.

N = number; MVI = microvascular invasion; CEUS = contrast-enhanced ultrasound; RFA = radiofrequency ablation; CNN = convolutional neural networks; MTM = macrotabecular massive; TACE = transarterial chemoembolization; PFS = progression free survival; VECT = vessels encapsulating tumor clusters.

* C-index was obtained from the validation.

Table 2.
Representative studies on clinical application of radiomics in primary liver cancer other than hepatocellular carcinoma
Reference Task Imaging Patient N Validation (Patient N) Main findings*
Park et al. 2019 [22] IHCC, Recurrence after surgery CT 345 External (112) C-index for radiologic model: 0.65
C-index for radiomics-radiologic model: 0.71
Ji et al. 2019 [27] Bile duct cancer, LN metastasis CT 155 Internal (52) C-index for radiomics-clinical model: 0.80
High risk for LN metastasis predicted by radiomics-clinical model was independent predictor for survival after surgery.
Ji et al. 2019 [24] IHCC, LN metastasis CT 103 Internal (52) C-index for nomogram incorporating radiomics model and CA19-9: 0.892. High-risk for LN metastasis group had poorer recurrence free and overall survival compared with low-risk group.
Zhou et al. 2021 [25] IHCC, MVI CT 126 Internal (38) C-index for radiomics model in predicting MVI: 0.85
Chu et al. 2021 [28] IHCC, Noncurative surgery CT 203 Internal (61) Radiomics model (C-index, 0.804) had better performance than clinical model (C-index, 0.59) and had similar performance to radiomics-clinical model (C-index, 0.8) in validation. Sensitivity and specificity of radiomics model in predicting noncurative surgery = 0.846 and 0.771, respectively.
Song et al. 2023 [23] IHCC, Early recurrence CT 311 External (61) Better performance of radiomics-clinical model (C-index, 0.871, 0.878) compared with AJCC 8th TNM stage (C-index 0.702, 0.712) in predicting early recurrence.
Zhou et al. 2022 [29] Differentiation between IHCC vs cHCC-CC MRI 216 Internal (65) C-index for radiomics model: 0.809
C-index for nomogram incorporating radiomics model, AFP, and underlying liver disease: 0.897

IHCC= intrahepatic cholangiocarcinoma; LN = lymph node; MVI = microvascular invasion; cHCC-CC = combined hepatocellular cholangiocarcinoma

* C-index was obtained from the validation.

References

1. Lee G, Lee HY, Park H, et al. Radiomics and its emerging role in lung cancer research, imaging biomarkers and clinical management: State of the art. Eur J Radiol 2017;86:297-307.
crossref pmid
2. Park HJ, Park B, Lee SS. Radiomics and Deep Learning: Hepatic Applications. Korean J Radiol 2020;21:387-401.
crossref pmid pmc pdf
3. Zwanenburg A, Vallieres M, Abdalah MA, et al. The Image Biomarker Standardization Initiative: Standardized Quantitative Radiomics for High-Throughput Image-based Phenotyping. Radiology 2020;295:328-338.
crossref pmid
4. Liu F, Liu D, Wang K, et al. Deep Learning Radiomics Based on Contrast-Enhanced Ultrasound Might Optimize Curative Treatments for Very-Early or Early-Stage Hepatocellular Carcinoma Patients. Liver Cancer 2020;9:397-413.
crossref pmid pmc pdf
5. Kim S, Shin J, Kim DY, Choi GH, Kim MJ, Choi JY. Radiomics on Gadoxetic Acid-Enhanced Magnetic Resonance Imaging for Prediction of Postoperative Early and Late Recurrence of Single Hepatocellular Carcinoma. Clin Cancer Res 2019;25:3847-3855.
crossref pmid pdf
6. Yu Y, Fan Y, Wang X, et al. Gd-EOB-DTPA-enhanced MRI radiomics to predict vessels encapsulating tumor clusters (VETC) and patient prognosis in hepatocellular carcinoma. Eur Radiol 2022;32:959-970.
crossref pmid pdf
7. Berenguer R, Pastor-Juan MDR, Canales-Vazquez J, et al. Radiomics of CT Features May Be Nonreproducible and Redundant: Influence of CT Acquisition Parameters. Radiology 2018;288:407-415.
crossref pmid
8. Carbonell G, Kennedy P, Bane O, et al. Precision of MRI radiomics features in the liver and hepatocellular carcinoma. Eur Radiol 2022;32:2030-2040.
crossref pmid pdf
9. Moons KG, Altman DG, Reitsma JB, et al. Transparent Reporting of a multivariable prediction model for Individual Prognosis or Diagnosis (TRIPOD): explanation and elaboration. Ann Intern Med 2015;162:W1-73.
crossref pmid
10. Choi SH, Lee SS, Park SH, et al. LI-RADS Classification and Prognosis of Primary Liver Cancers at Gadoxetic Acidenhanced MRI. Radiology 2019;290:388-397.
crossref pmid
11. Rhee H, Cho ES, Nahm JH, et al. Gadoxetic acid-enhanced MRI of macrotrabecular-massive hepatocellular carcinoma and its prognostic implications. J Hepatol 2021;74:109-121.
crossref pmid
12. Kitao A, Matsui O, Zhang Y, et al. Dynamic CT and Gadoxetic Acid-enhanced MRI Characteristics of P53-mutated Hepatocellular Carcinoma. Radiology 2023;306:e220531.
crossref pmid
13. Kang HJ, Kim H, Lee DH, et al. Gadoxetate-enhanced MRI Features of Proliferative Hepatocellular Carcinoma Are Prognostic after Surgery. Radiology 2021;300:572-582.
crossref pmid
14. Choi SY, Kim SH, Park CK, et al. Imaging Features of Gadoxetic Acid-enhanced and Diffusion-weighted MR Imaging for Identifying Cytokeratin 19-positive Hepatocellular Carcinoma: A Retrospective Observational Study. Radiology 2018;286:897-908.
crossref pmid
15. Lee S, Kim SH, Lee JE, Sinn DH, Park CK. Preoperative gadoxetic acid-enhanced MRI for predicting microvascular invasion in patients with single hepatocellular carcinoma. J Hepatol 2017;67:526-534.
crossref pmid
16. Xu X, Zhang HL, Liu QP, et al. Radiomic analysis of contrastenhanced CT predicts microvascular invasion and outcome in hepatocellular carcinoma. J Hepatol 2019;70:1133-1144.
crossref pmid
17. Yang L, Gu D, Wei J, et al. A Radiomics Nomogram for Preoperative Prediction of Microvascular Invasion in Hepatocellular Carcinoma. Liver Cancer 2019;8:373-386.
crossref pmid pmc pdf
18. Ji GW, Zhu FP, Xu Q, et al. Machine-learning analysis of contrast-enhanced CT radiomics predicts recurrence of hepatocellular carcinoma after resection: A multi-institutional study. EBioMedicine 2019;50:156-165.
crossref pmid pmc
19. Ji GW, Zhu FP, Xu Q, et al. Radiomic Features at Contrast-enhanced CT Predict Recurrence in Early Stage Hepatocellular Carcinoma: A Multi-Institutional Study. Radiology 2020;294:568-579.
crossref pmid
20. Feng Z, Li H, Liu Q, et al. CT Radiomics to Predict Macrotrabecular-Massive Subtype and Immune Status in Hepatocellular Carcinoma. Radiology 2023;307:e221291.
crossref pmid
21. Longato E, Vettoretti M, Di Camillo B. A practical perspective on the concordance index for the evaluation and selection of prognostic time-to-event models. J Biomed Inform 2020;108:103496.
crossref pmid
22. Park HJ, Park B, Park SY, et al. Preoperative prediction of postsurgical outcomes in mass-forming intrahepatic cholangiocarcinoma based on clinical, radiologic, and radiomics features. Eur Radiol 2021;31:8638-8648.
crossref pmid pdf
23. Song Y, Zhou G, Zhou Y, et al. Artificial intelligence CT radiomics to predict early recurrence of intrahepatic cholangiocarcinoma: a multicenter study. Hepatol Int 2023.
crossref pdf
24. Ji GW, Zhu FP, Zhang YD, et al. A radiomics approach to predict lymph node metastasis and clinical outcome of intrahepatic cholangiocarcinoma. Eur Radiol 2019;29:3725-3735.
crossref pmid pdf
25. Zhou Y, Zhou G, Zhang J, Xu C, Wang X, Xu P. Radiomics signature on dynamic contrast-enhanced MR images: a potential imaging biomarker for prediction of microvascular invasion in mass-forming intrahepatic cholangiocarcinoma. Eur Radiol 2021;31:6846-6855.
crossref pmid pdf
26. Orlhac F, Frouin F, Nioche C, Ayache N, Buvat I. Validation of A Method to Compensate Multicenter Effects Affecting CT Radiomics. Radiology 2019;291:53-59.
crossref pmid
27. Ji GW, Zhang YD, Zhang H, et al. Biliary Tract Cancer at CT: A Radiomics-based Model to Predict Lymph Node Metastasis and Survival Outcomes. Radiology 2019;290:90-98.
crossref pmid
28. Chu H, Liu Z, Liang W, et al. Radiomics using CT images for preoperative prediction of futile resection in intrahepatic cholangiocarcinoma. Eur Radiol 2021;31:2368-2376.
crossref pmid pdf
29. Zhou Y, Zhou G, Zhang J, Xu C, Zhu F, Xu P. DCE-MRI based radiomics nomogram for preoperatively differentiating combined hepatocellular-cholangiocarcinoma from massforming intrahepatic cholangiocarcinoma. Eur Radiol 2022;32:5004-5015.
crossref pmid pdf
TOOLS
METRICS Graph View
  • 0 Crossref
  •  0 Scopus
  • 1,232 View
  • 24 Download
ORCID iDs

Seung Soo Lee
https://orcid.org/0000-0002-5518-2249

Related articles


ABOUT
BROWSE ARTICLES
EDITORIAL POLICY
FOR CONTRIBUTORS
Editorial Office
103-1103, The Sharp Seocho, 21, Seochojungang-ro 2-gil, Seocho-gu, Seoul 06720, Korea
Tel: +82-2-3474-1983    Fax: +82-2-3474-1982    E-mail: office@ksar.kr                

Copyright © 2024 by The Korean Society of Abdominal Radiology.

Developed in M2PI

Close layer
prev next